

Back to futurelearn
Topic 6A - Introduction To Climate Monitoring
Featured Images and Example Data
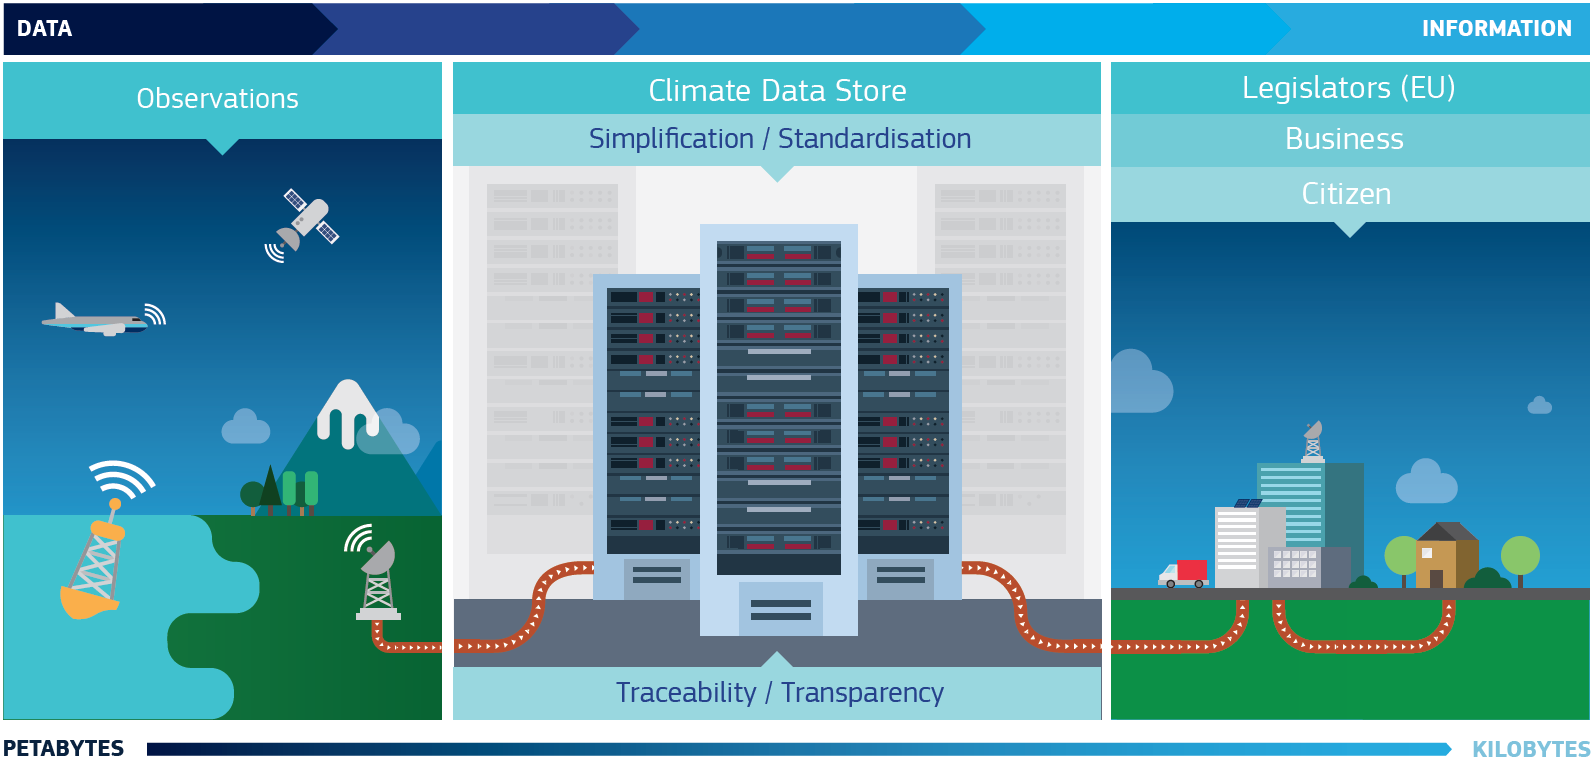
C3S Infographic
This infographic shows the data flow of the Climate Change Service (C3S) from satellite observations to the Climate Data Store and on to the users of the data
©
Copernicus C3S
Source Link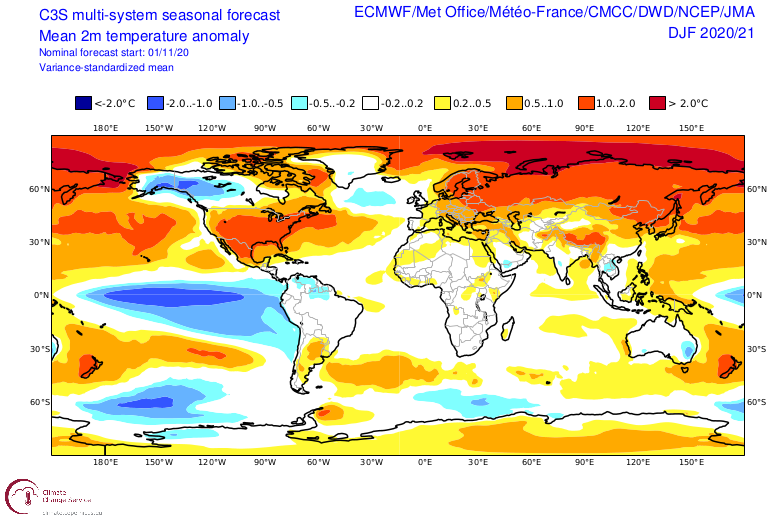
C3S seasonal forecast
This is a C3S multi-system seasonal forecast for mean 2m temperature anomaly for December, January and February 2020/21
©
Copernicus C3S
Source Link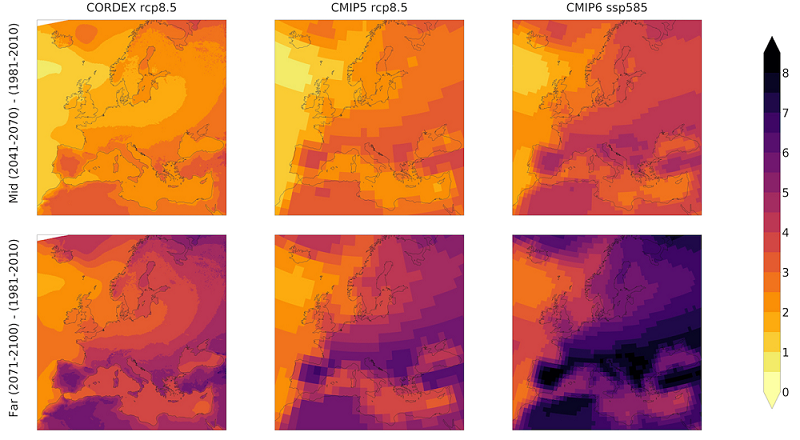
Climate Projection
Projected mean temperature change in summer (June, July, August) for 2041–2070 (top row) and 2071–2100 (bottom row) with respect to the 1981–2010 average.
©
Coppola et al., 2021.
Source Link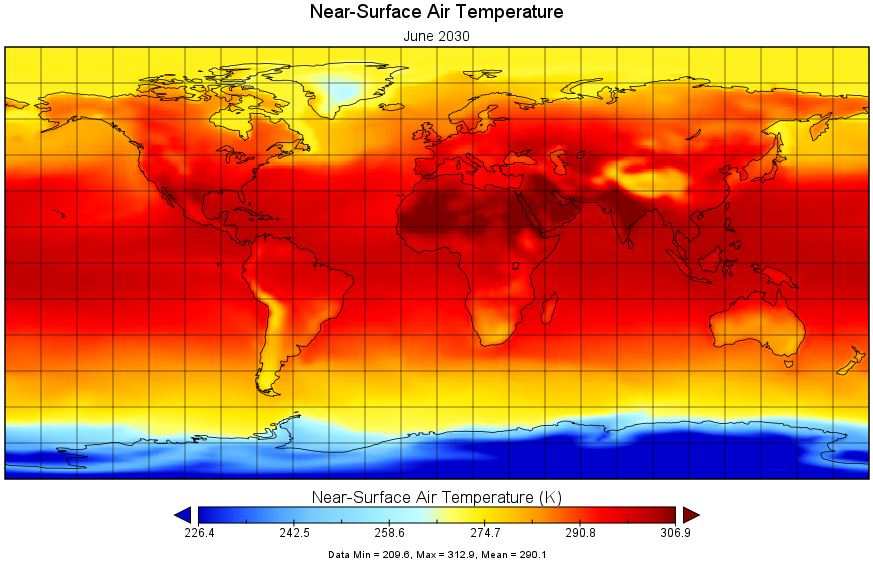
Near-surface air temperature, 2030
This is a C3S climate projection of global near-surface air temperature for June 2030
©
Copernicus C3S
Source LinkFeatured Video and Animations

Storm Alex - Meteosat 11
This is a series of Meteosat 11 images overlaid with H SAF Precipitation rate at ground during Storm Alex over France from 1 October - 4 October 2020
©
EUMETSAT
Source Link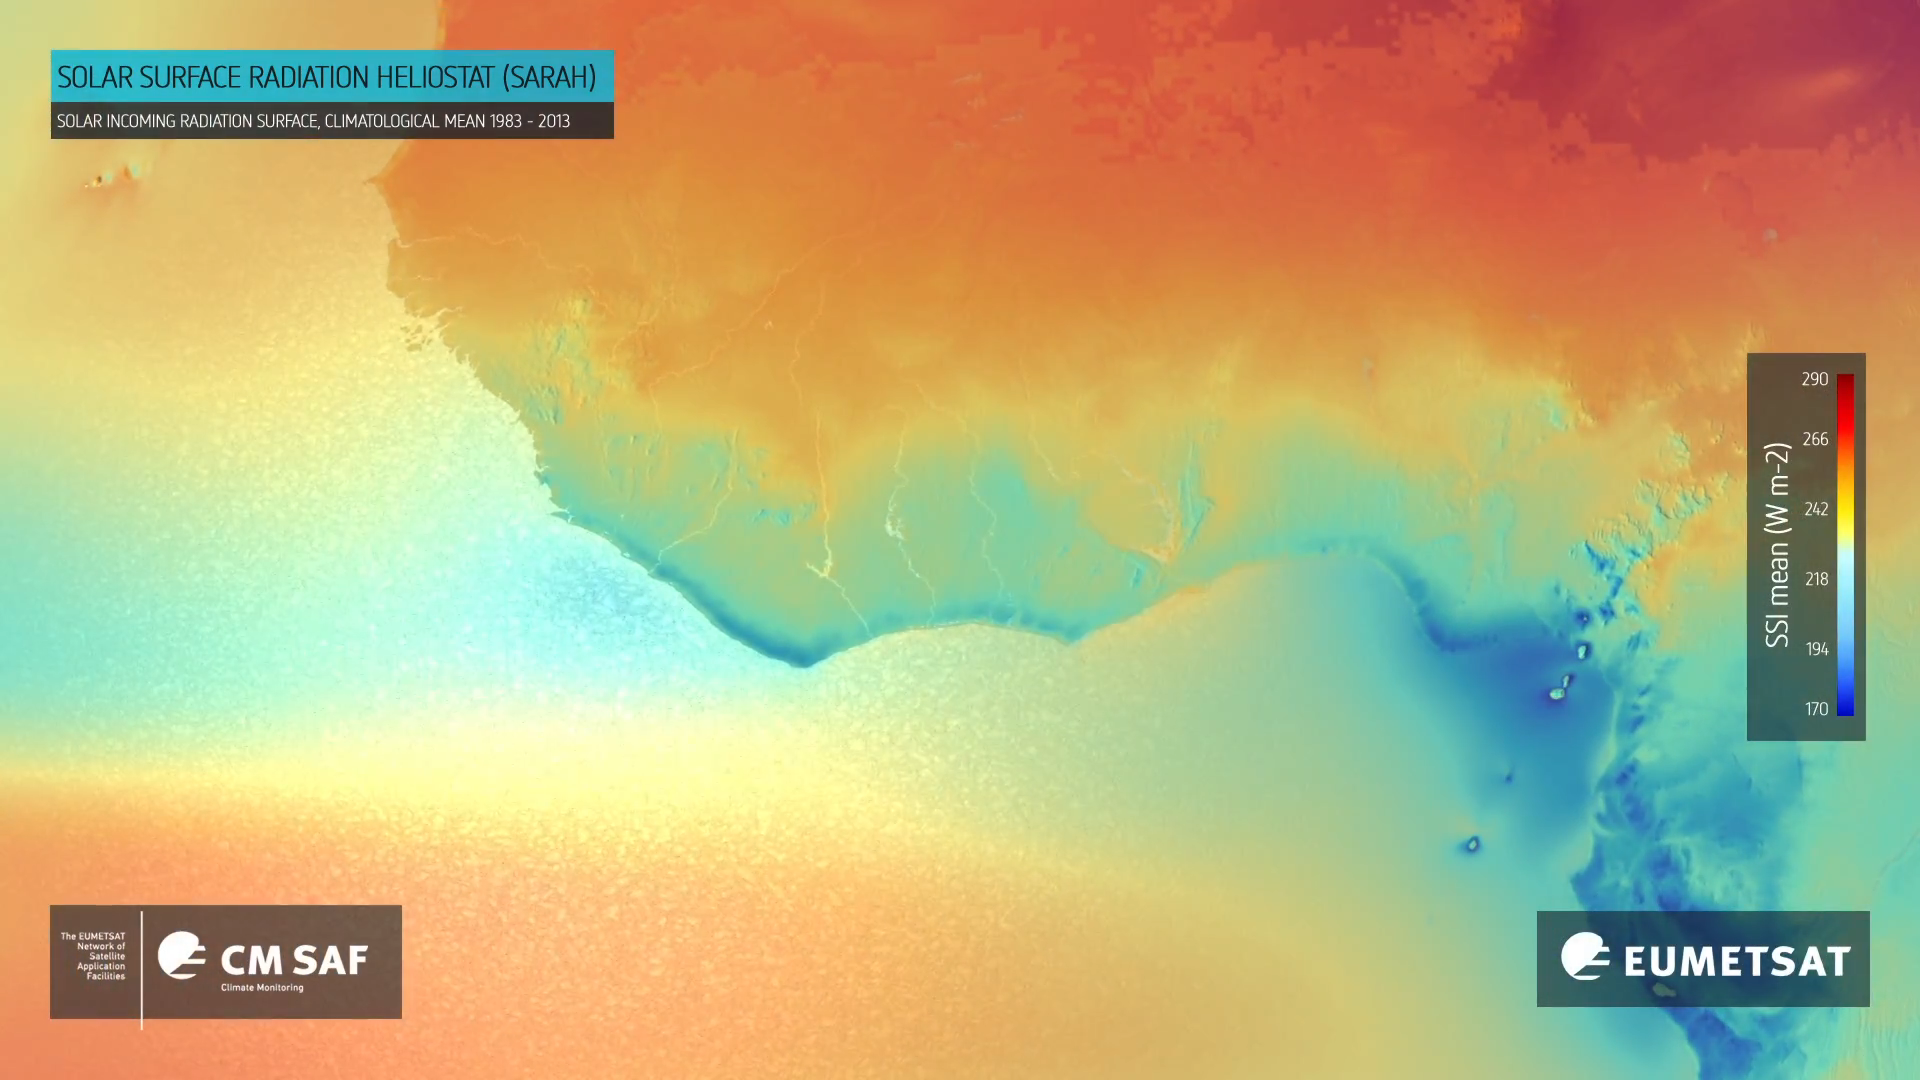
30 Years of Surface Irradiance
This visualisation showcases the SARAH (Surface Solar Radiation Heliostat) climate data record from the EUMETSAT Climate Monitoring SAF and shows the mean average surface irradiance from 1983 to 2013 of areas in central and southern Africa.
©
EUMETSAT
Source Link
Sign up to our newsletter to get updates from Imperative MOOCs
Thank you! Your submission has been received!
Oops! Something went wrong while submitting the form.