

Back to futurelearn
Topic 4F - Using ML To Differentiate Between Sediment and Chlorophyl
Featured Images and Example Data
No items found.
Featured Video and Animations
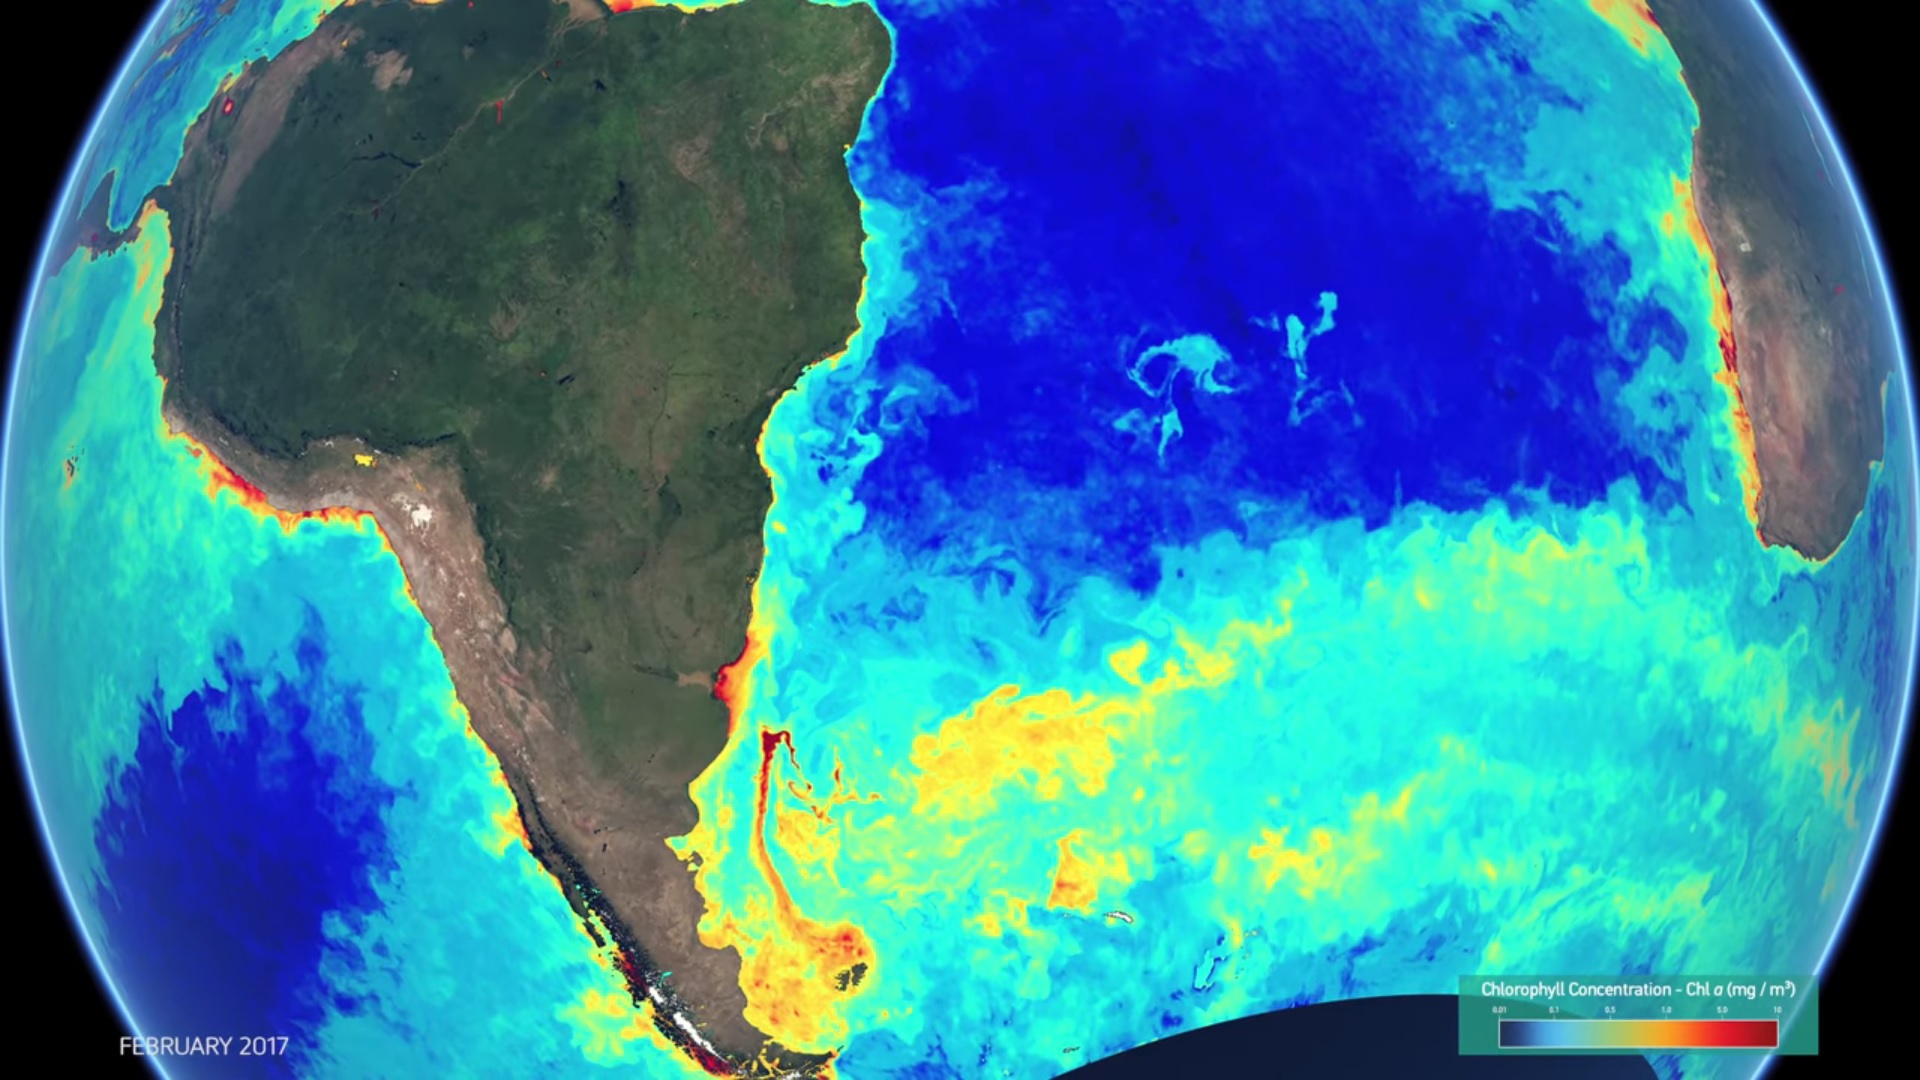
Global Ocean Colour - 2017
This visualisation, narrated by Dr Hayley Evers-King of the Plymouth Marine Laboratory, shows a year of ocean chlorophyll measurements, as observed by satellites such as the Copernicus Sentinel-3 series, which are operated by EUMETSAT.
©
EUMETSAT
Source Link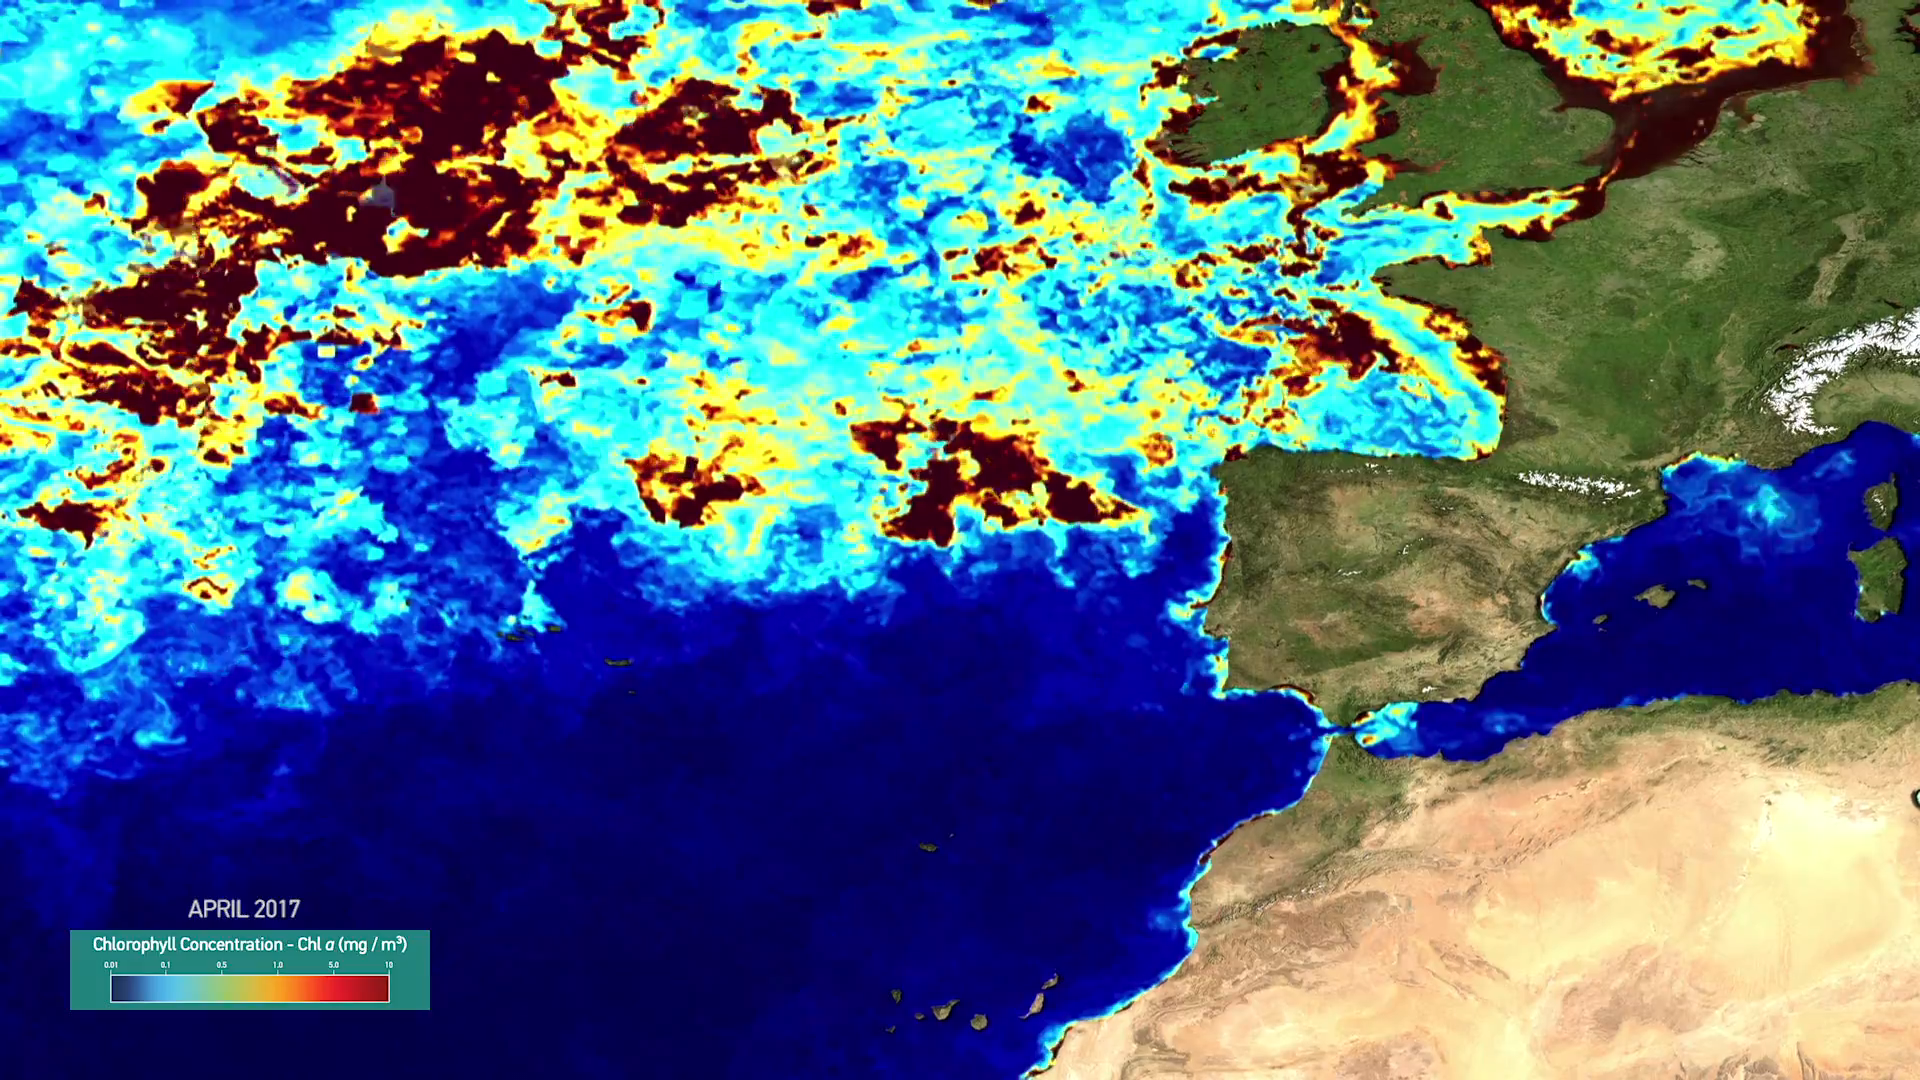
Atlantic Ocean Colour
This visualisation shows ocean colour in the north Atlantic and along the Iberian coast, caused by Chlorophyll activity from January - July 2017. Audio commentary is provided by EUMETSAT's remote sensing scientist, Ewa Kwiatkowska.
©
EUMETSAT
Source Link

Sentinel-3 scans Earth's colour
Animation of Sentinel-3 using it's Ocean and Land Colour Instrument (OLCI) instrument
©
ESA/ATG medialab
Source Link
Iberian Biscay Ireland Regional Seas - Biogeochemistry Model
This video shows a biogeochemistry Model of Chlorophyll Concentration, with outputs interpolated every 6 hours for 2014
©
Copernicus Marine Service
Source Link
Sign up to our newsletter to get updates from Imperative MOOCs
Thank you! Your submission has been received!
Oops! Something went wrong while submitting the form.