

Back to futurelearn
Topic 5F - ML For More Accurate Weather Forecasts
Featured Images and Example Data
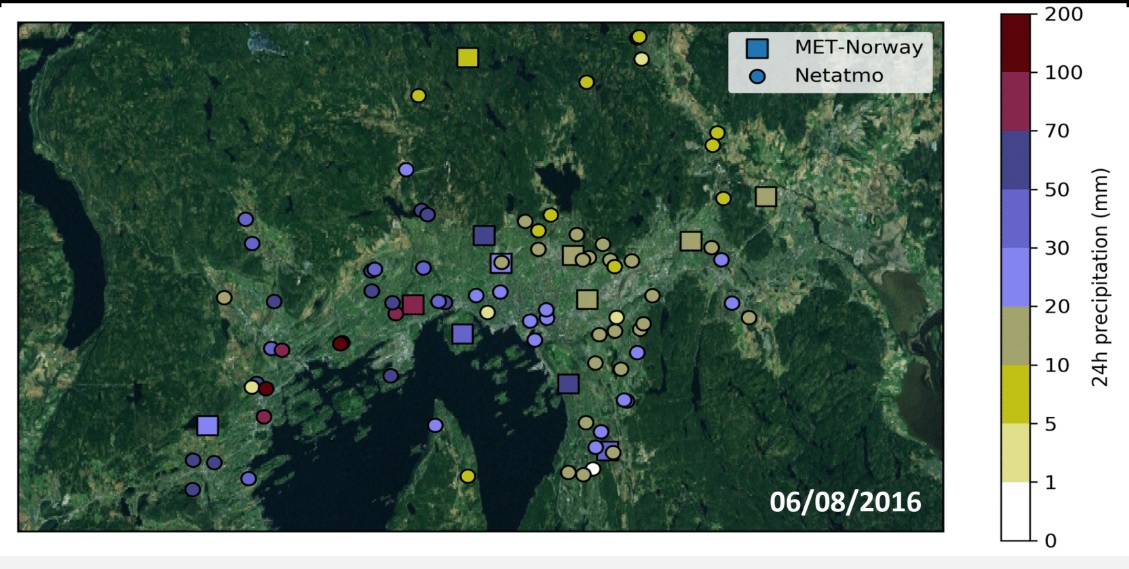
Comparison during an extreme rain event
Comparison between Met Norway in situ observations and Netatmo observations for precipitation during an extreme rain event. Netatmos observations show a good agreement with MetNorway and cover a far greater area
©
Met Norway
Source Link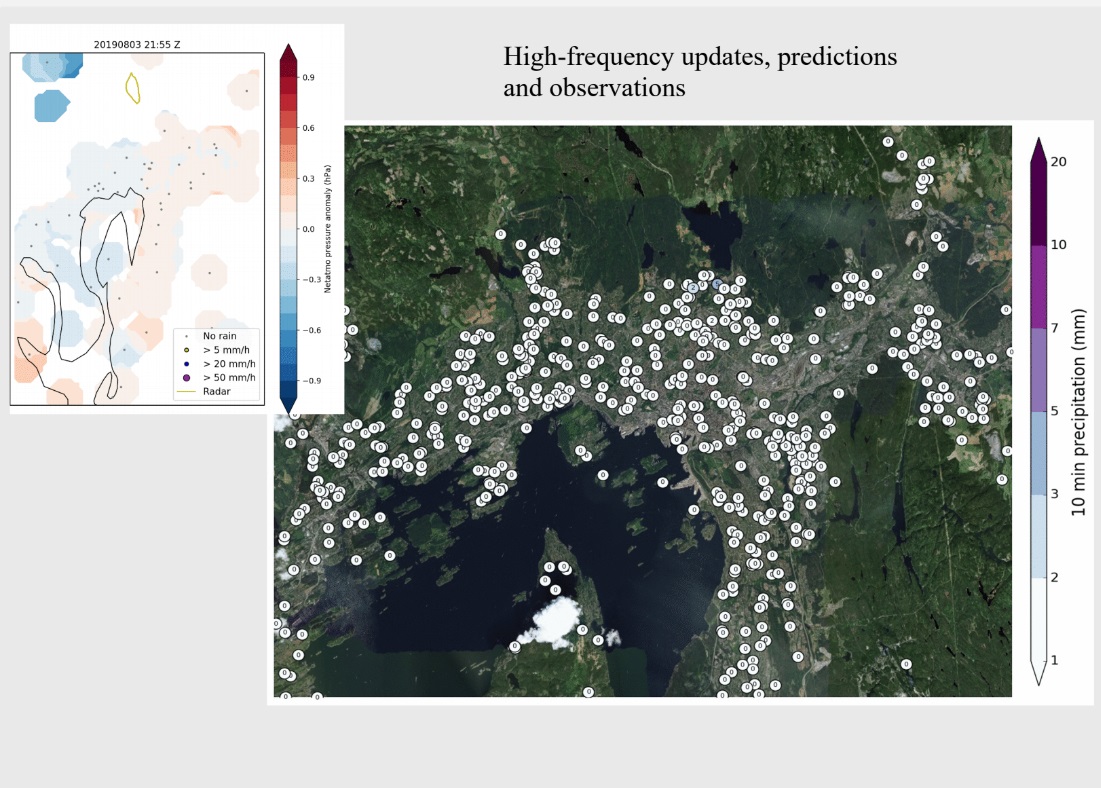
High-frequency updates,predictions and observations - Met Norway
Oslo 4 August 2019 (right) 10-min snapshots of Netatmo rainfall (left) same as right but also with Netatmo MSLP anomalies (shaded) and radar precip intensity (contours)
©
Met Norway/Roel Stappers/Thomas Nipen
Source Link
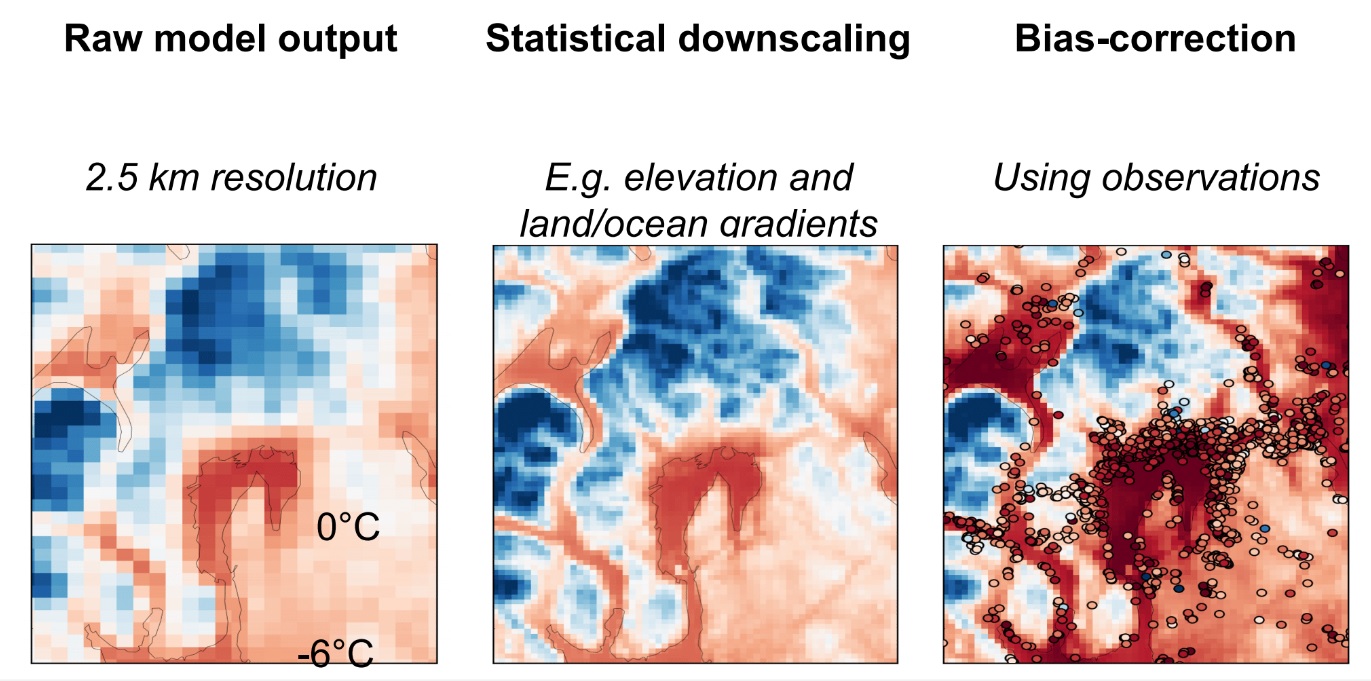
Combining NWP with observations
This image shows the raw NWP model image at 2.5km resolution (left), the statistical downscaling process (middle), bias correction - adding observations(right)
©
Met Norway
Source Link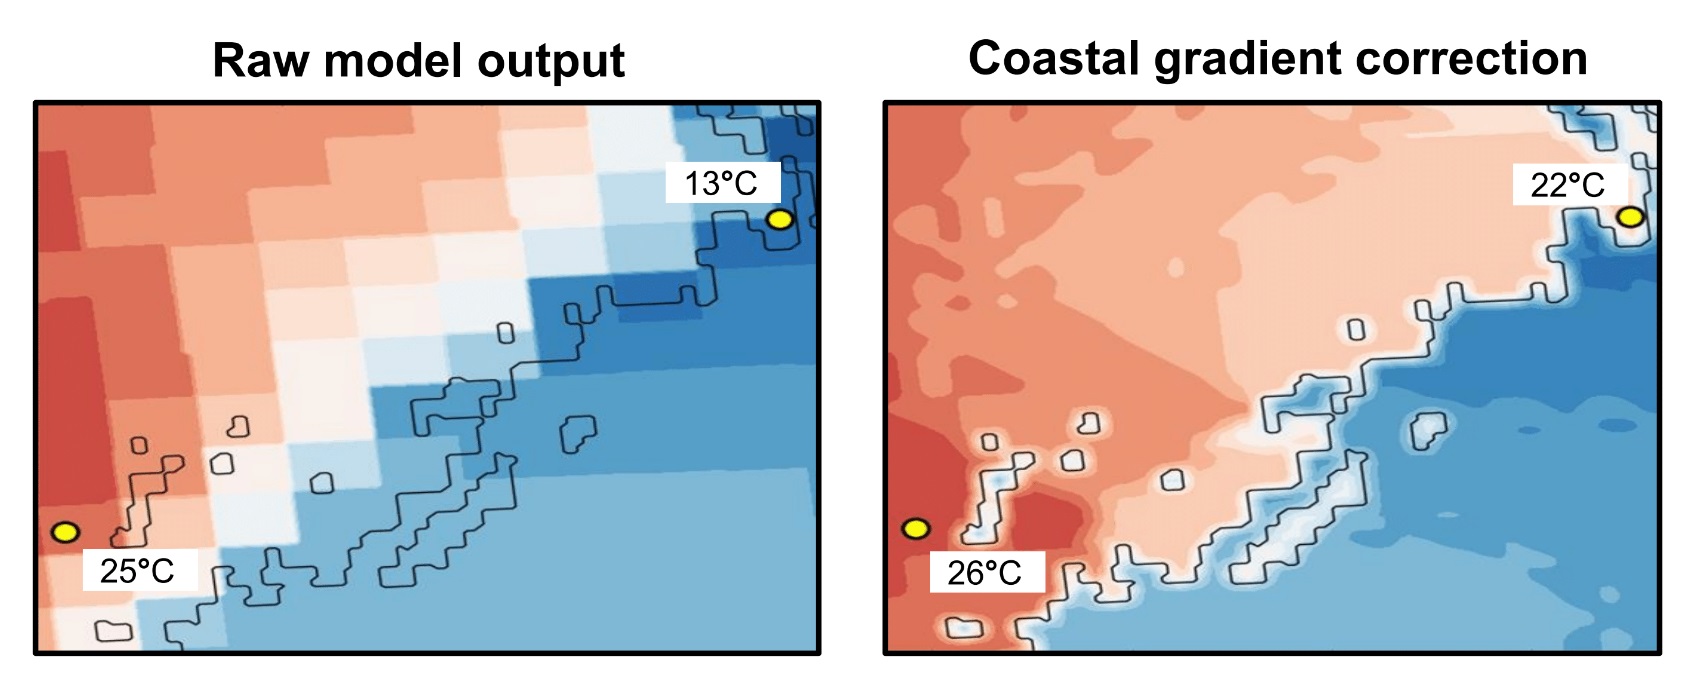
Downscaling along coastlines
These images show the downscaling process along a coastline. The raw model output is on the right, and the image on the left shows coastal gradient correction. Temperatures on the coast can be up to 10 degrees wrong - so land/ocean fraction can be used when interpolating to finer resolution
©
Met Norway
Source Link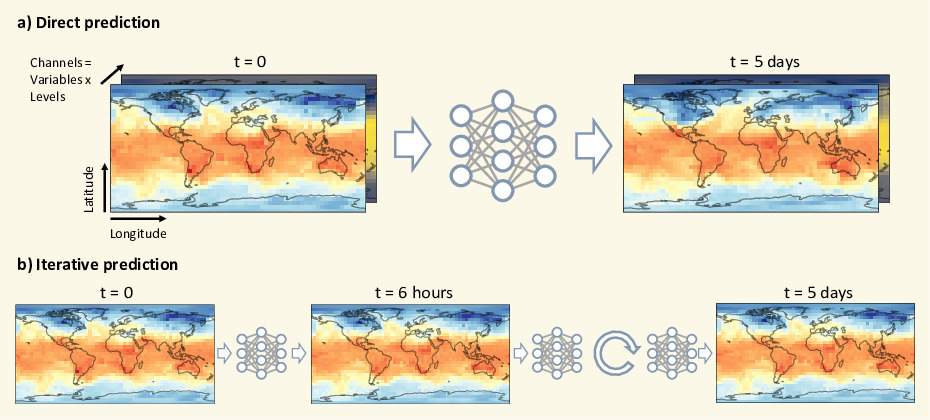
Schematic of data-driven weather forecasting
Example of direct weather prediction for 5 days lead time. The input to the neural network are fields on a latitude-longitude grid. The fields can be several levels of the same variable and/or different variables. The goal is to predict the same fields some time ahead. (b) Iterative forecasts are created from data-driven models trained on a shorter lead time, for example, 6 hr, which are then iteratively called up to the required forecast lead time.
©
Stephan Rasp, Peter Dueben et al., 2020
Source Link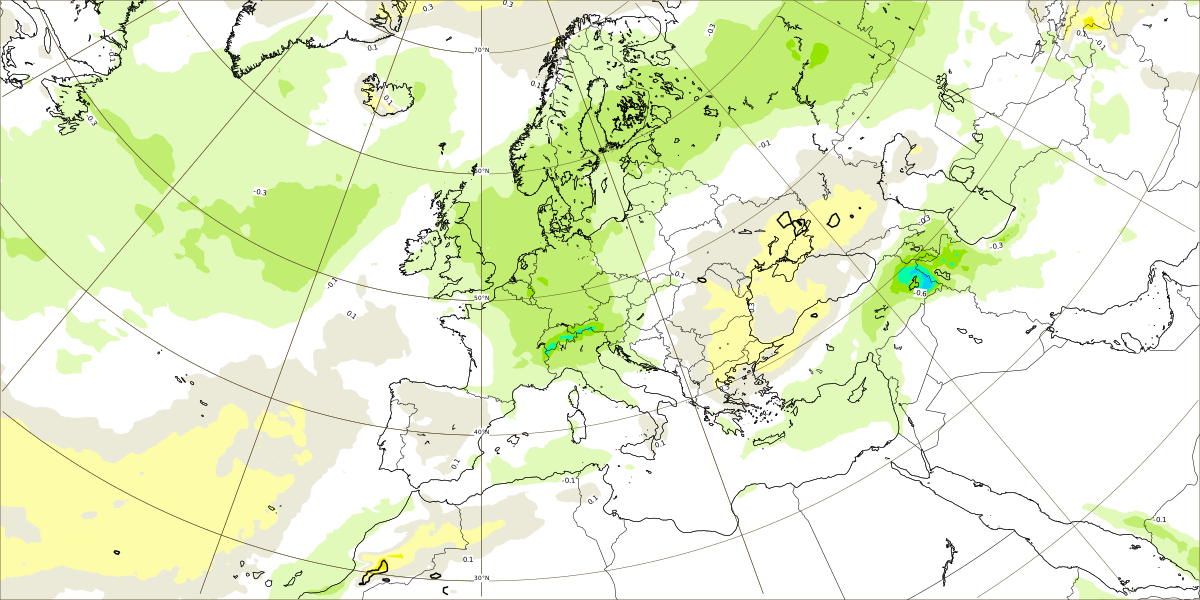
Extended range Extreme forecast index
This is an Extreme forecast index (EFI) of weekly precipitation in Europe
©
ECMWF
Source Link
Mean sea level pressure: Probability distribution
This is an ECMWF Mean sea level pressure: Probability distribution forecast
©
ECMWF
Source Link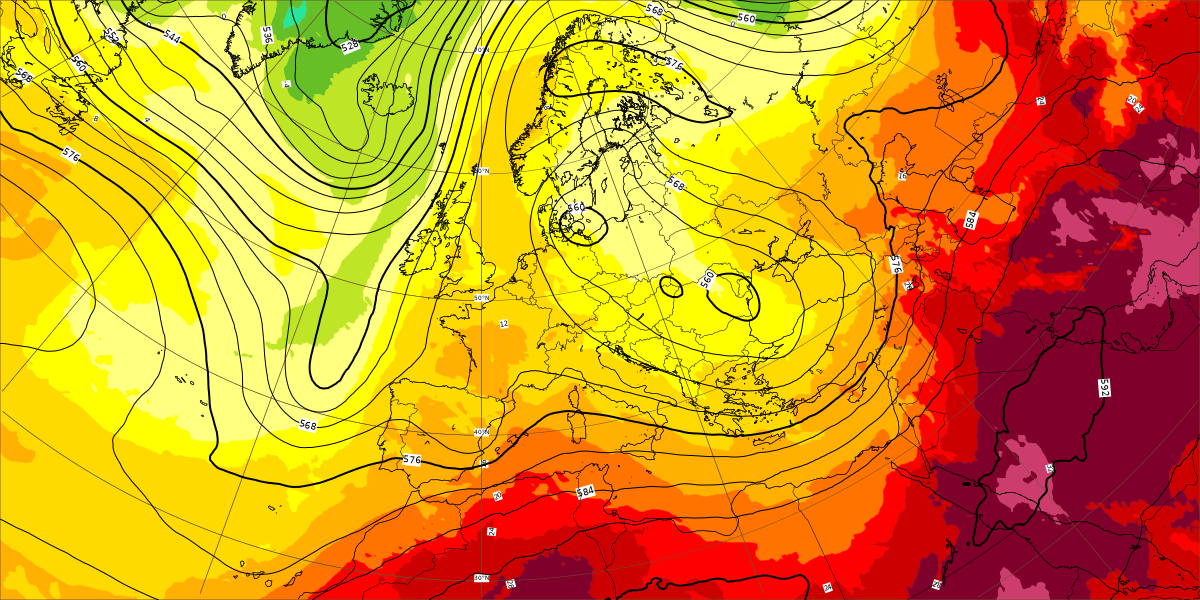
Geopotential and temperature forecast
This charts show 500 hPa geopotential height (contours) and temperature at 850 hPa (shading) from the ECMWF HRES model.
©
ECMWF
Source Link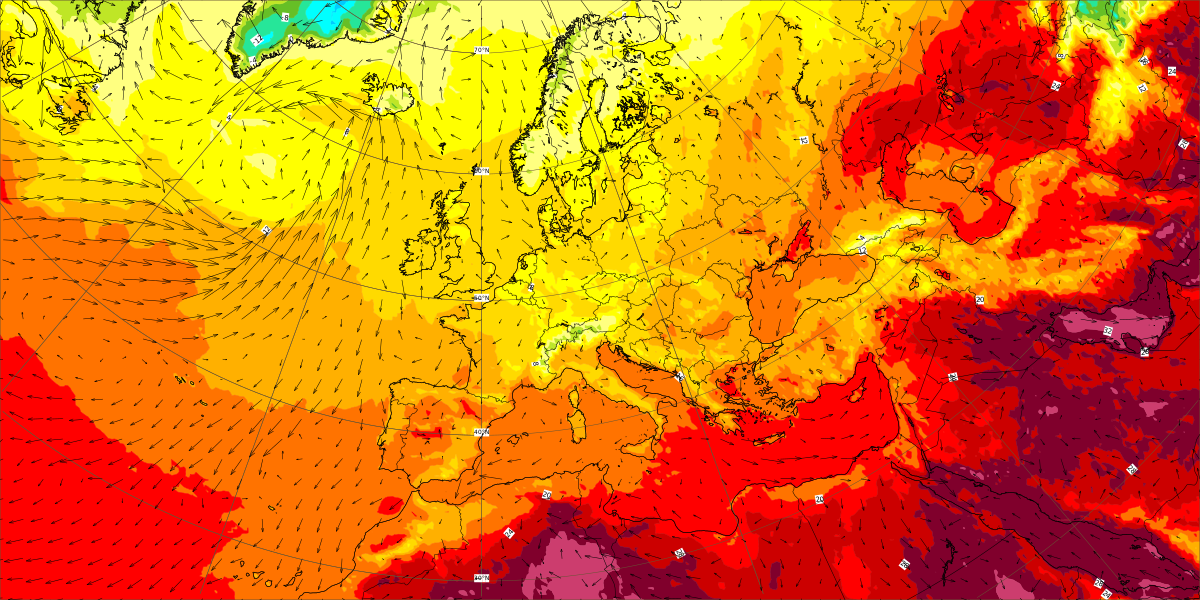
2m Temperature and 30m winds
This is an example of a 2m temperature (colour shading) and 30m winds (black arrows) forecast
©
ECMWF
Source LinkFeatured Video and Animations


NASA's Earth orbiting fleet
This animation shows the orbits of NASA's fleet of Earth observing spacecraft that are considered operational as of December 2019
©
NASA/Goddard Space Flight Center Scientific Visualization Studio
Source Link

Sign up to our newsletter to get updates from Imperative MOOCs
Thank you! Your submission has been received!
Oops! Something went wrong while submitting the form.