

Back to futurelearn
Topic 6D - ML To Help Navigate In Changing Polar Regions
Featured Images and Example Data
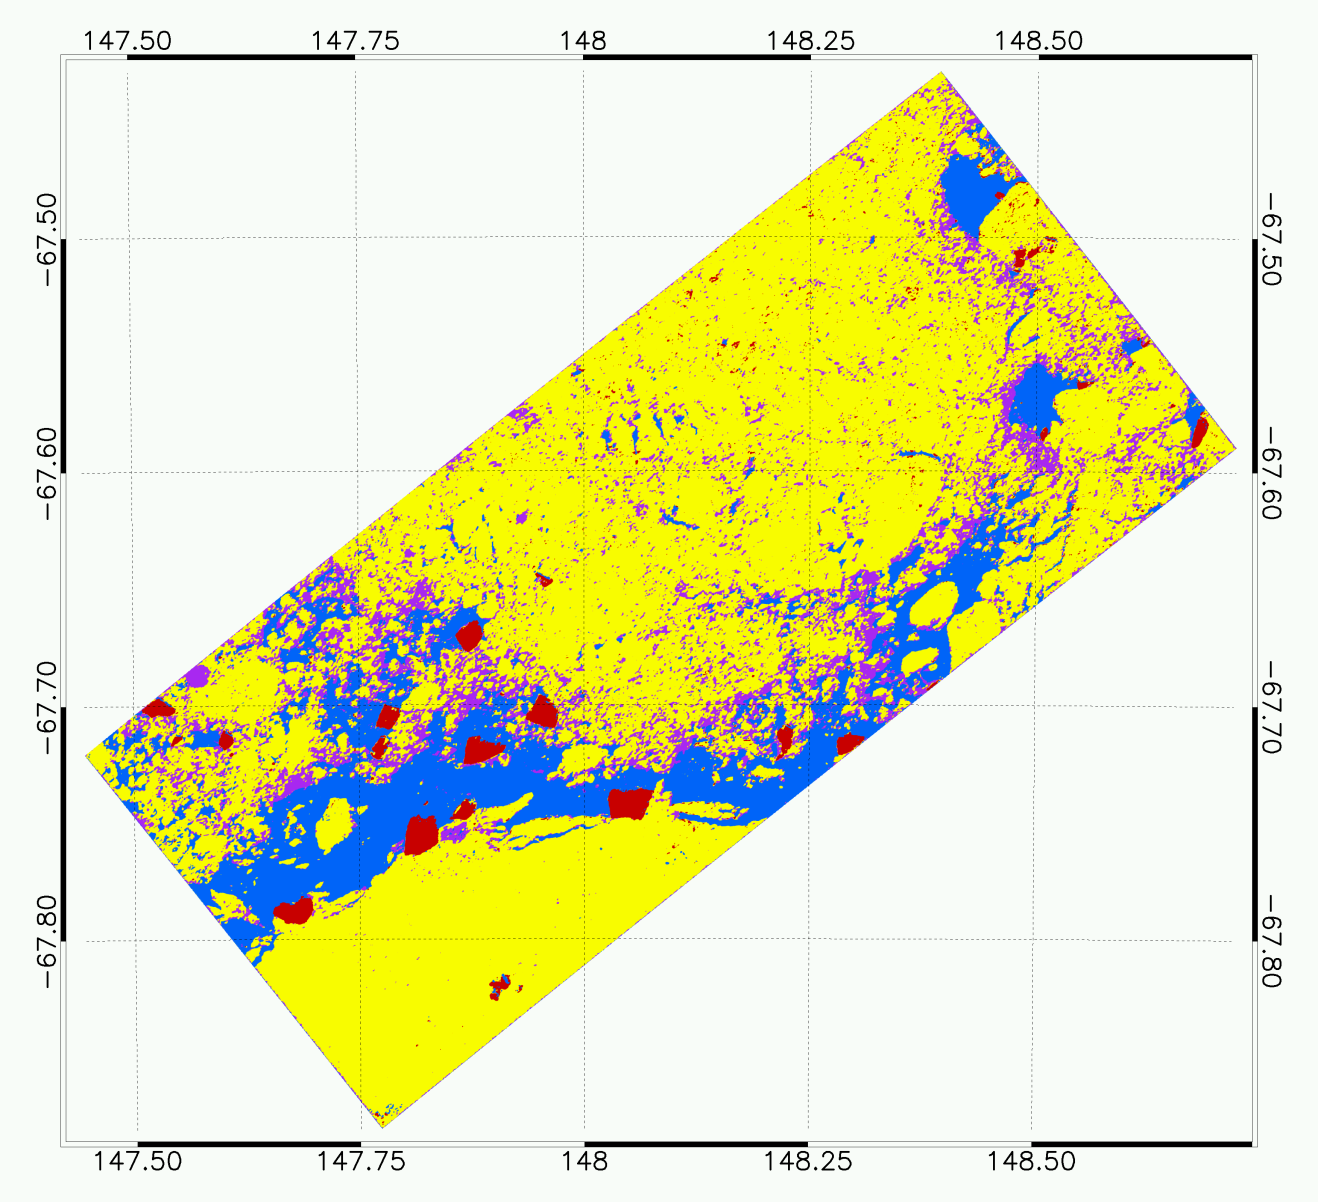
Polarimetric Ice classification
Image from Radarsat-2. Blue: Open Water/ Nilas (OW), Purple: Young Ice (YI), Yellow: First Year Ice (SFYI), Red: Rough First Year Ice/Multi - Year Ice/Ice Berg. Acquired on 30 January 2017, 10:36:35 UTC, showing an area of sea ice in the Arctic
©
DLR
Source Link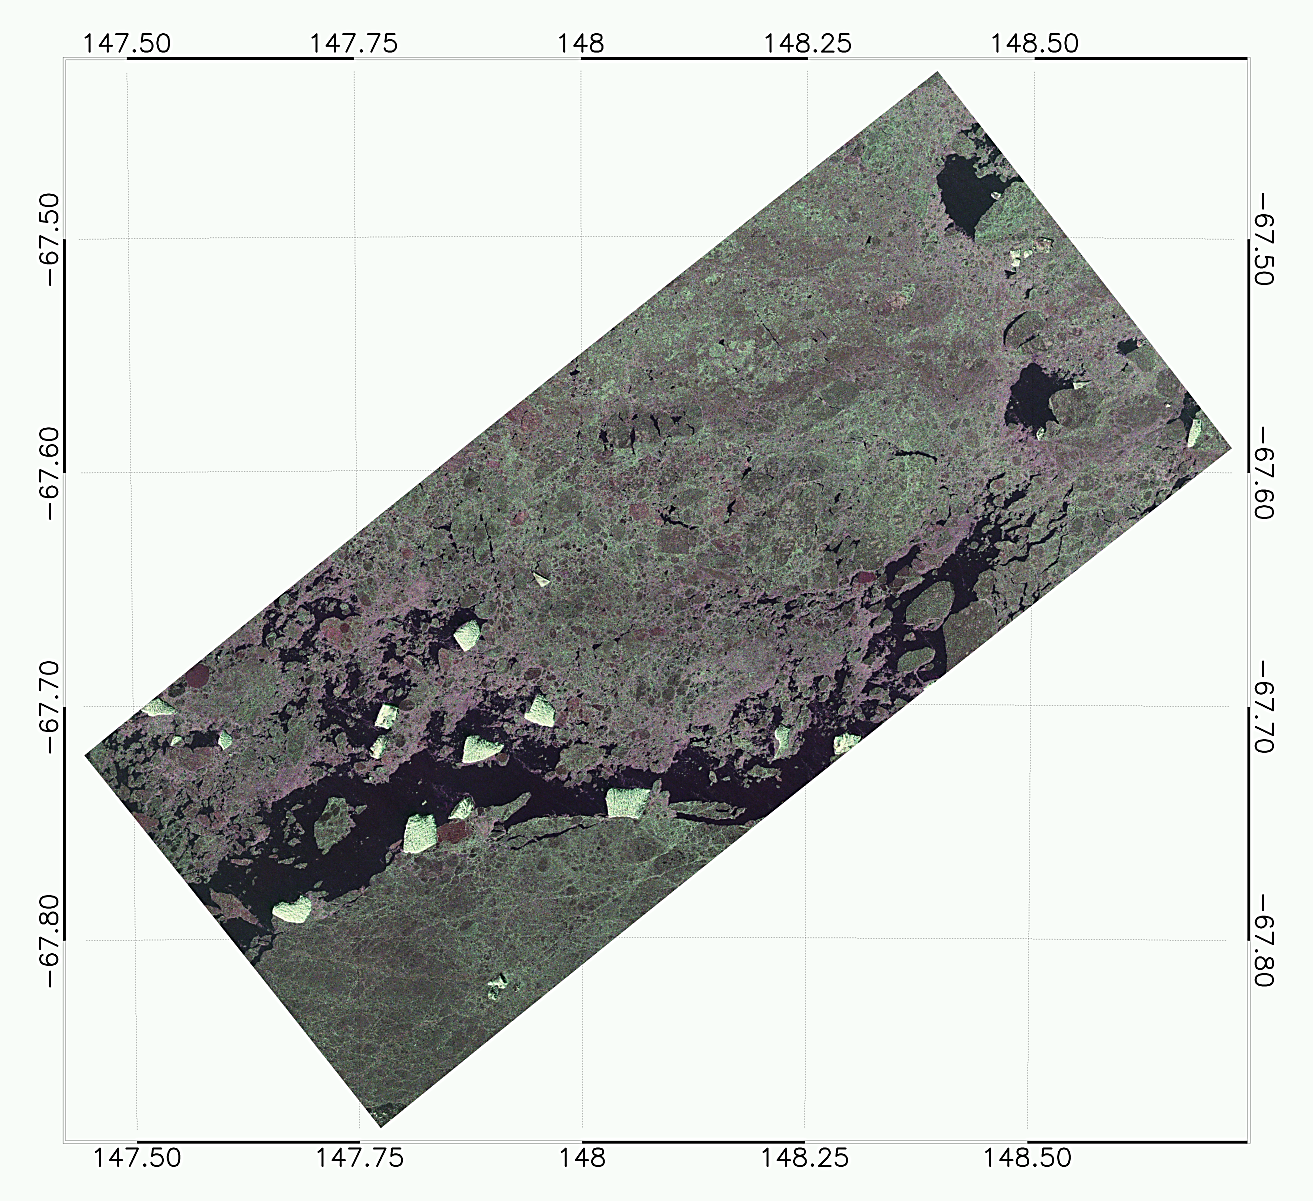
Geocoded Pauli RGB composite
A Radasat-2 Geocoded Pauli RGB composite image acquired on 30 January 2017, 10:36:35 UTC, showing an area of sea ice in the Arctic
©
DLR
Source Link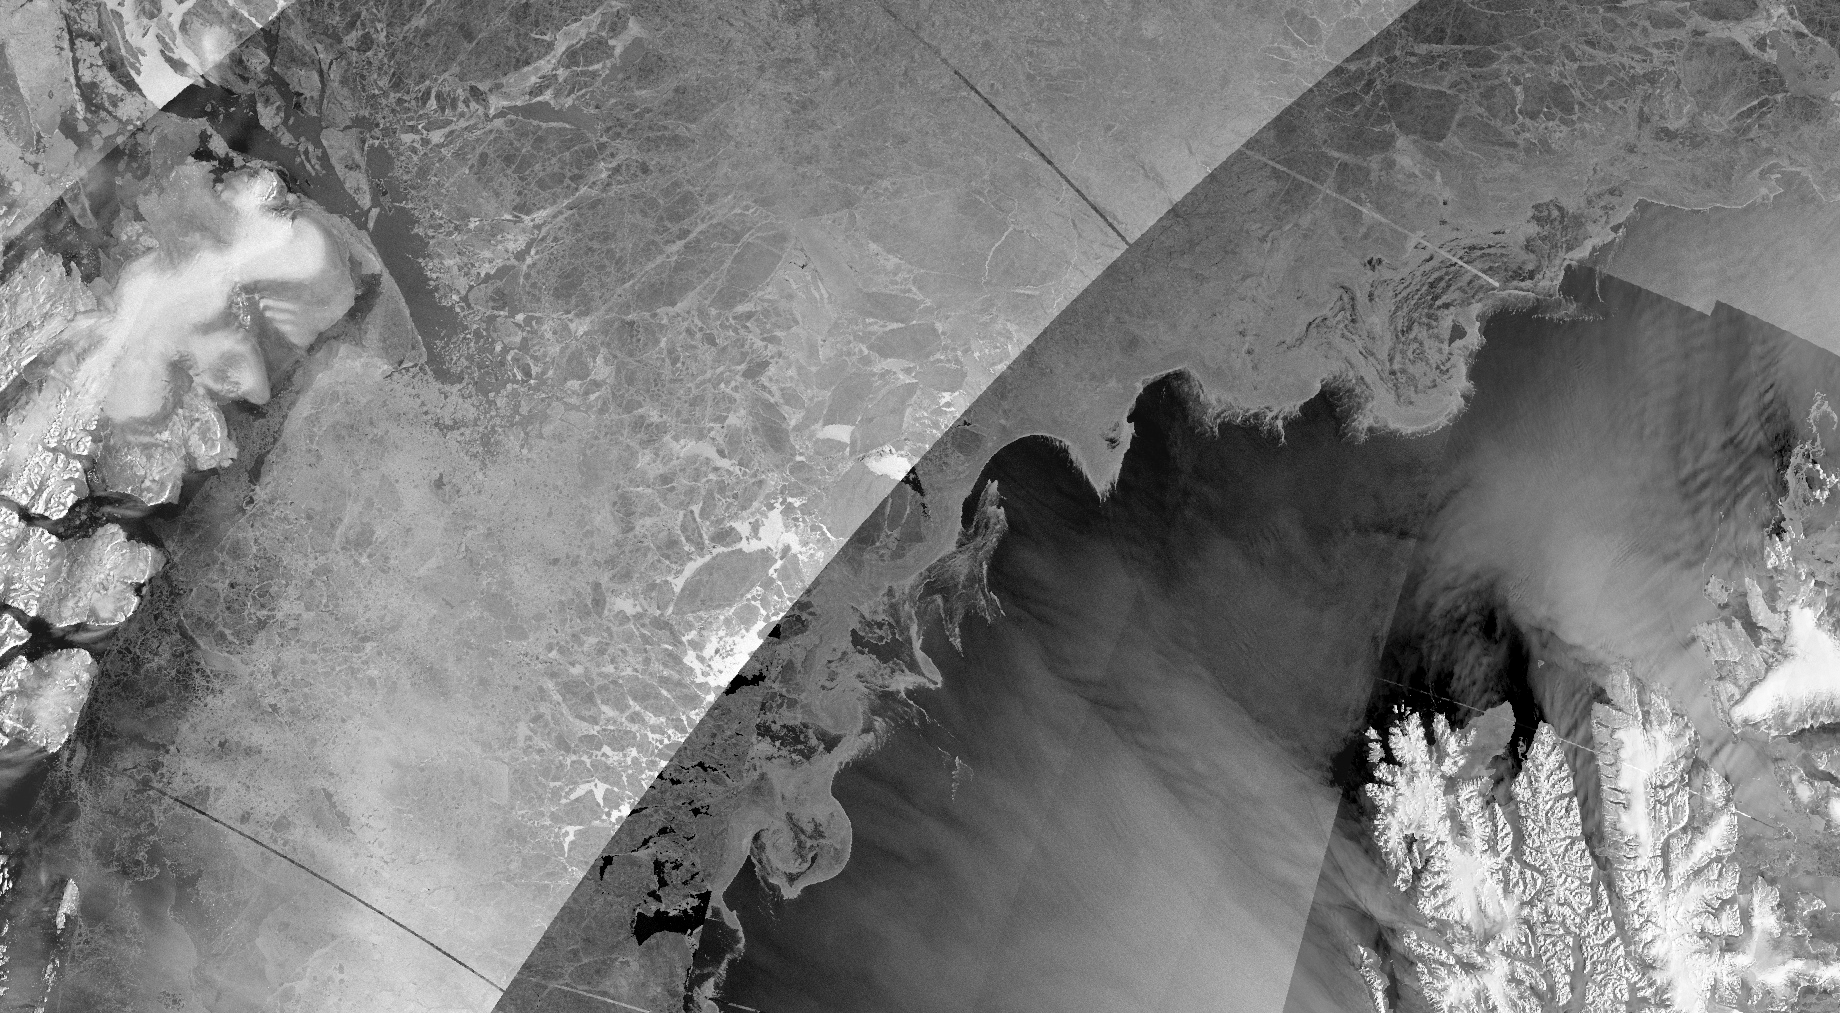
Sentinel-1 sea ice composite
This is a composit image of extra wide swath acquisitions by Sentinel-1
©
DLR/Copernicus Sentinel-1 data
Source Link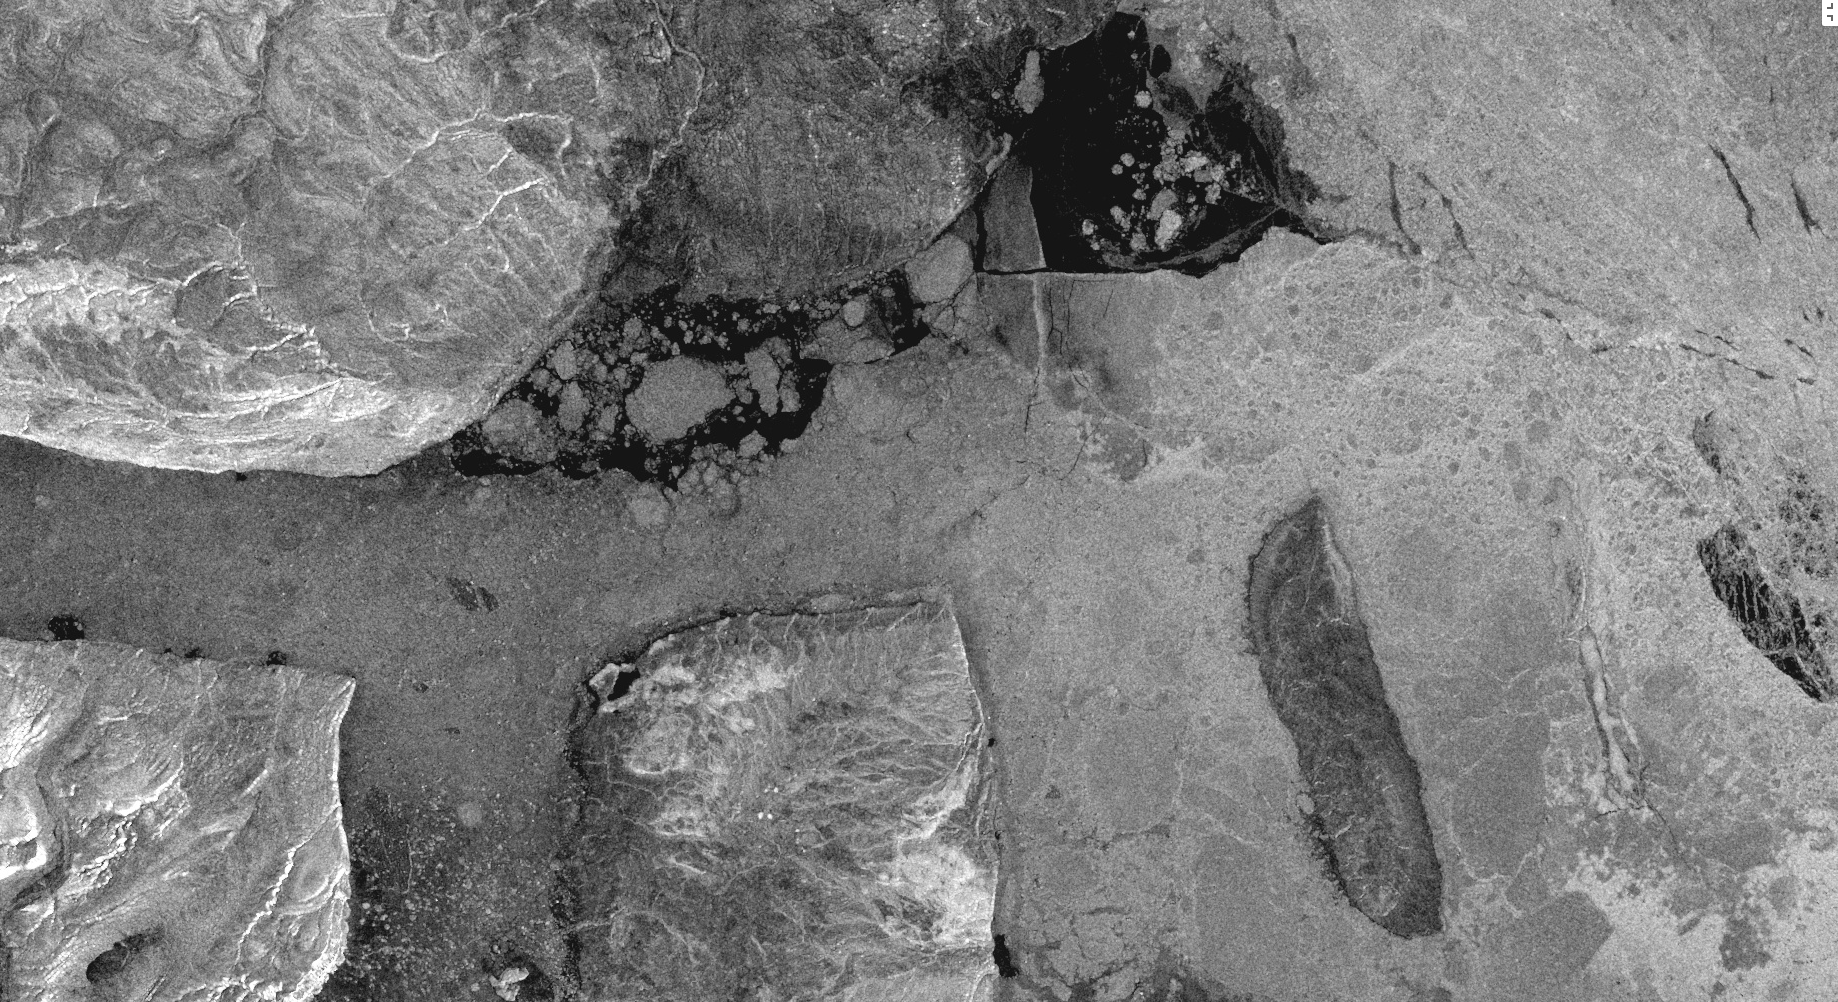
Sentinel-1 sea ice composite 2
This is another composite wide swath image acquired by Sentinel-1, of sea ice
©
DLR/Copernicus Sentinel-1 data
Source Link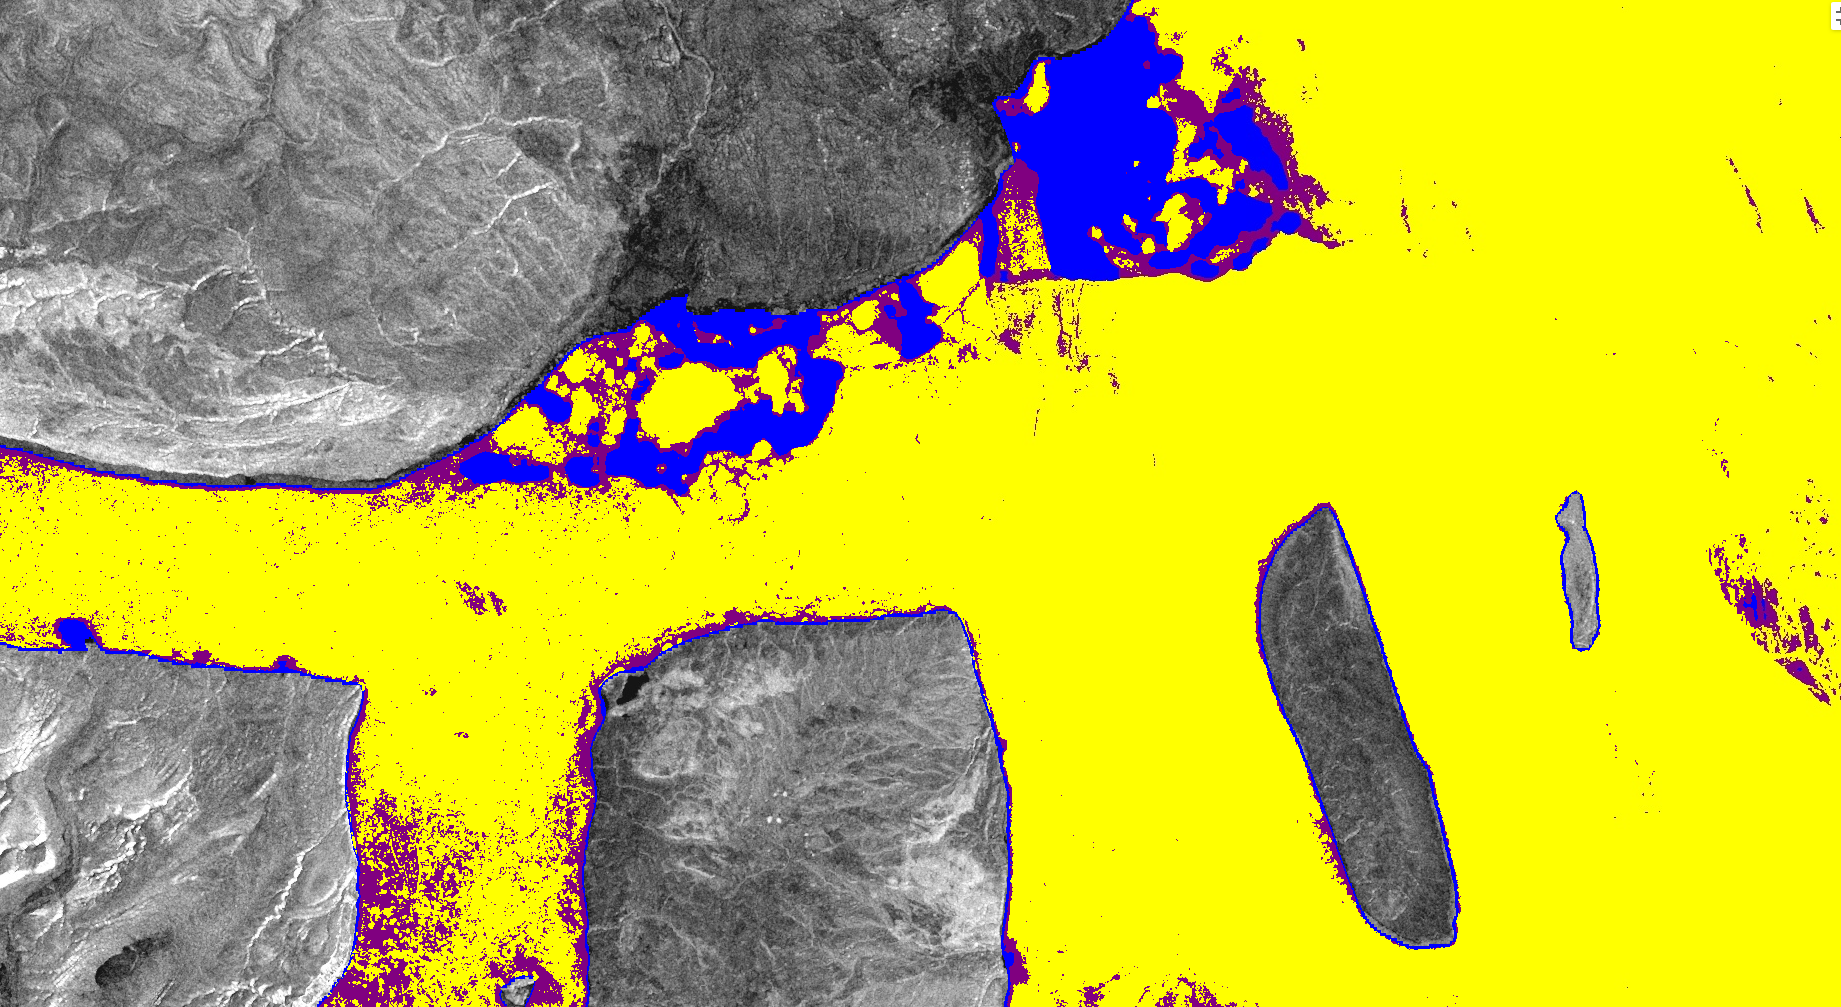
Sentinel-1 sea ice characterisation
This image shows sea ice characterisation overlaying the composite sentinel-1 imagery. The yellow shows smooth first year ice, the blue is open water, and the purple is young ice.
©
DLR/Copernicus Sentinel-1 data
Source Link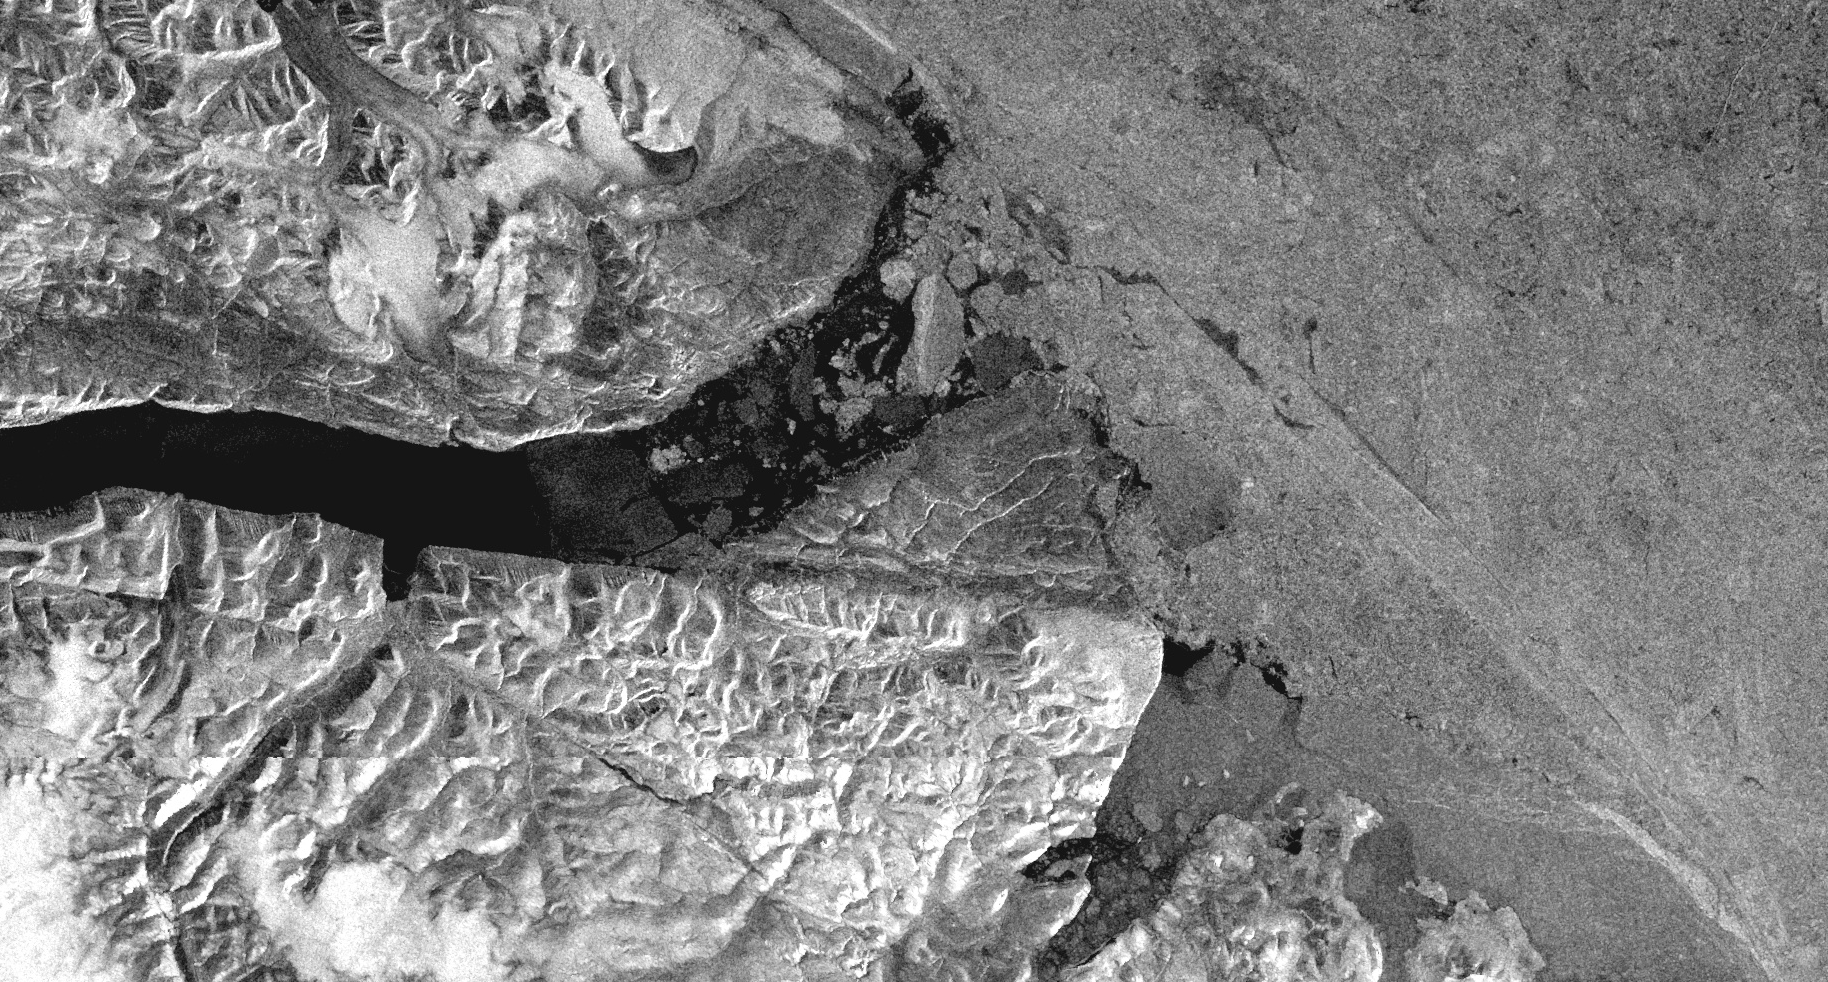
Sentinel-1 sea ice composite 3
This Sentinel-1 wide swath composite shows a channel in between two islands
©
DLR/Copernicus Sentinel-1 data
Source Link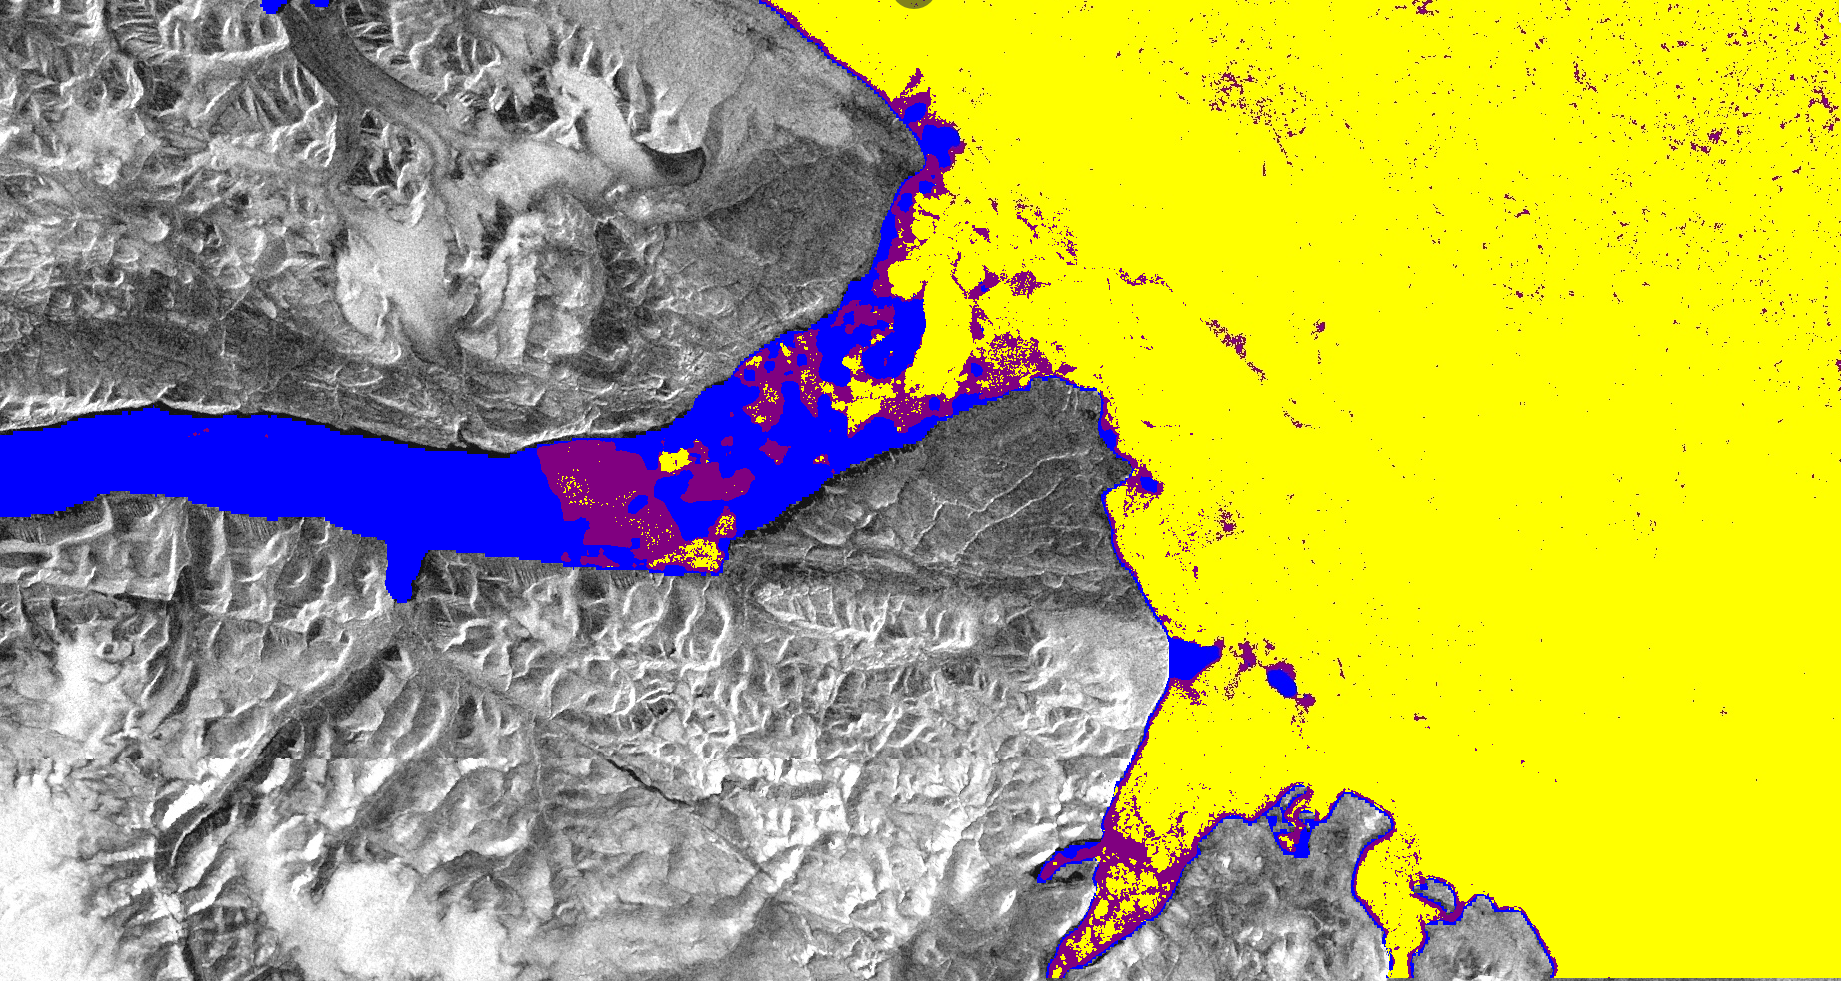
Sentinel-3 composite sea ice characterisation - channel
This image shows sea ice characterisation overlaying the composite sentinel-1 imagery. The yellow shows smooth first year ice, the blue is open water, and the purple is young ice.
©
DLR/Copernicus Sentinel-1 data
Source Link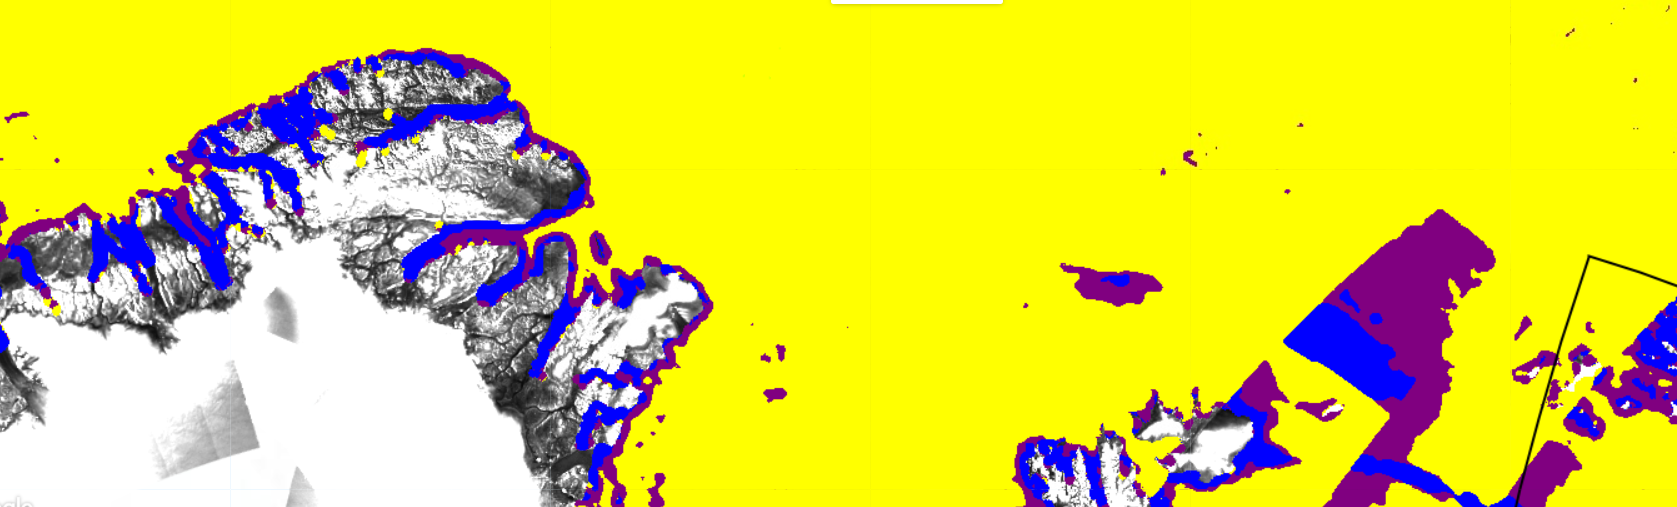
Sea ice characterisation
This image shows sea ice characterisation overlaying the composite sentinel-1 imagery. The yellow shows smooth first year ice, the blue is open water, and the purple is young ice.
©
DLR/Copernicus Sentinel-1 data
Source Link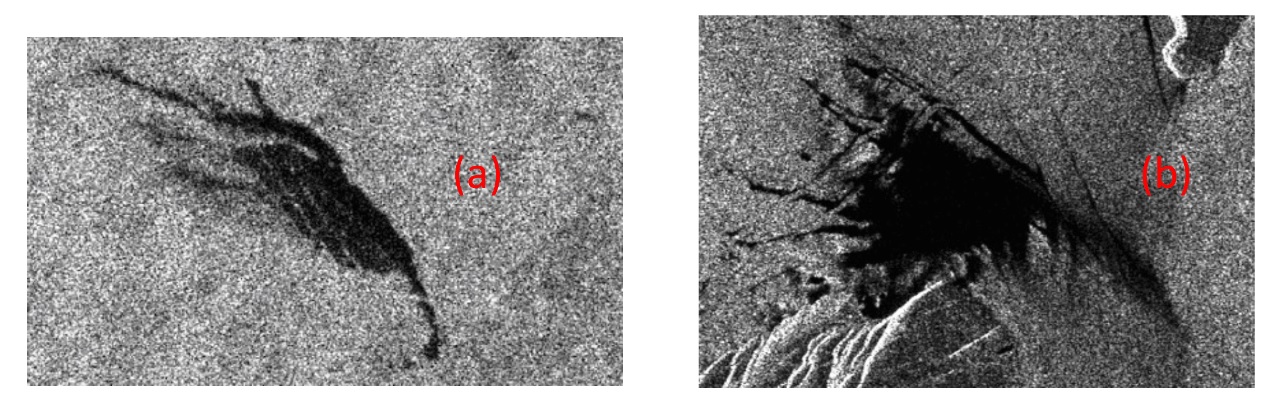
Oil spill look - alike issue
Two examples of dark spots : (a) Verified oil spill on a SAR image taken on 6 September 2005 close to Ancona , Italy . b) Verified look - alike on a SAR image taken on 25 August 2005 close to Otranto, Italy
©
DLR
Source Link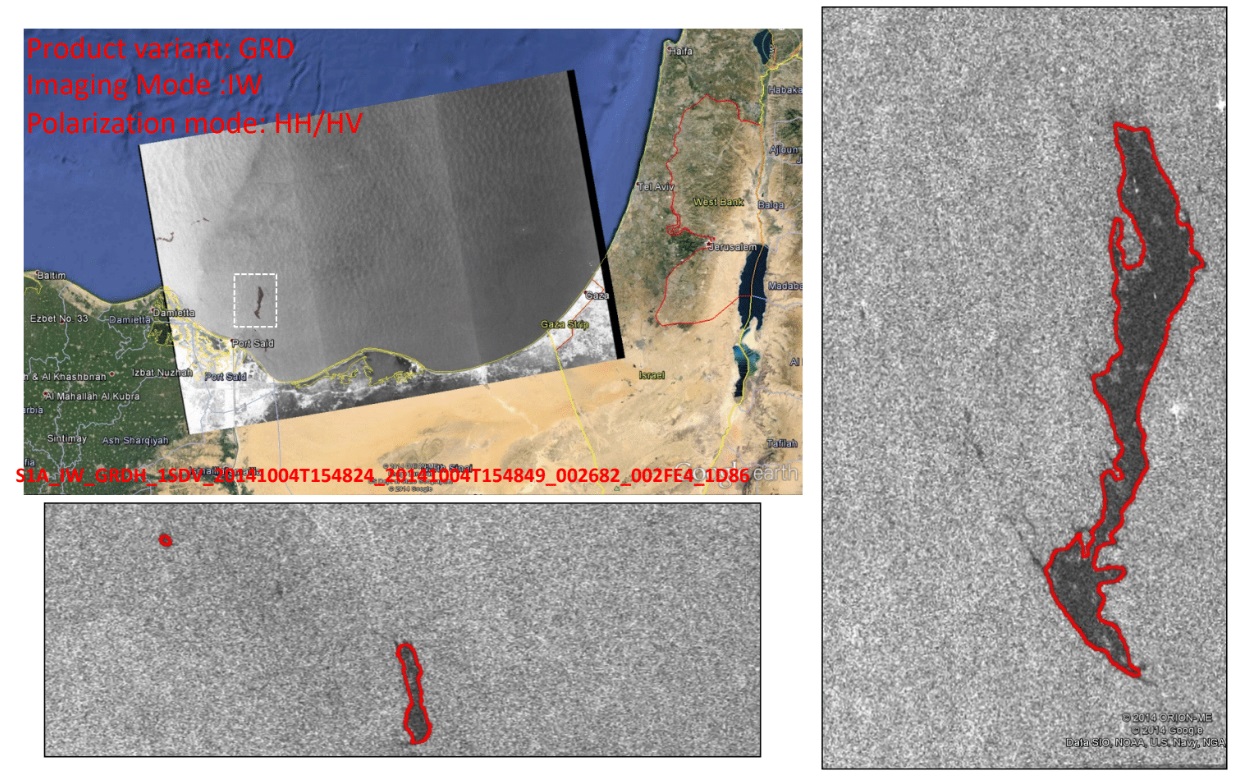
Sentinel-1 - Oil spill product
These are Sentinel-1 IW mode images of oil spills in the Mediterranean
©
DLR/Copernicus Sentinel-1 data
Source Link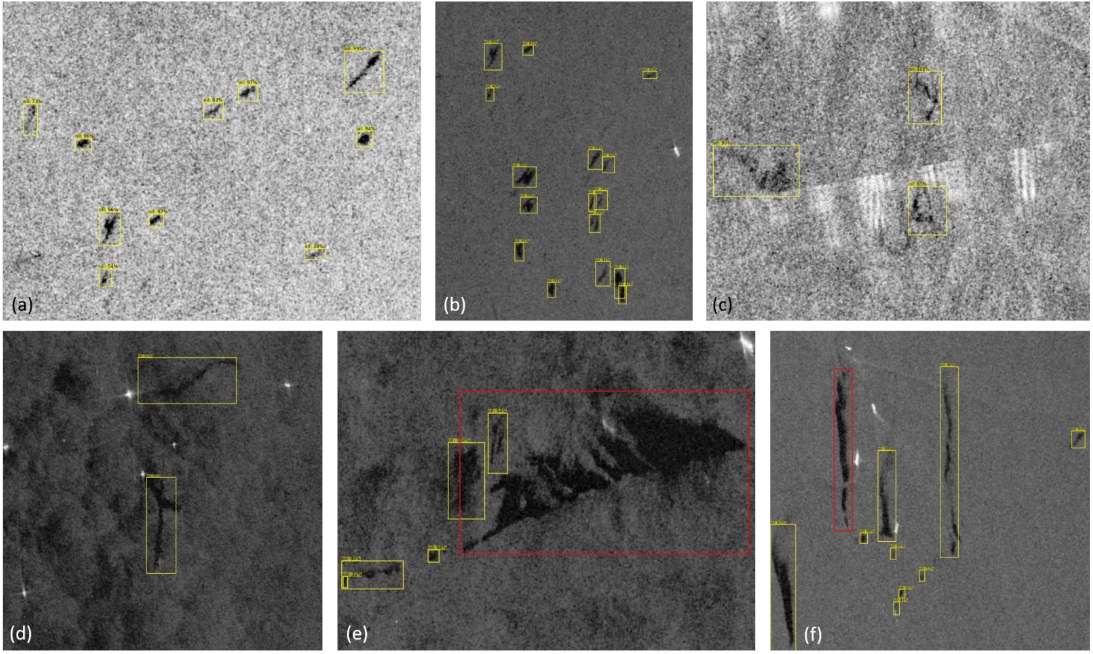
SAR oil spill detection
These SAR images of oil spills were detected by the deep neural network architecture Yolov4
©
Yi - Jie Yang, Suman Singha & Roberto Mayerle, Fully Automated Sar Based Oil Spill Detection Using Yolov4. I GARSS 2021
Source LinkFeatured Video and Animations
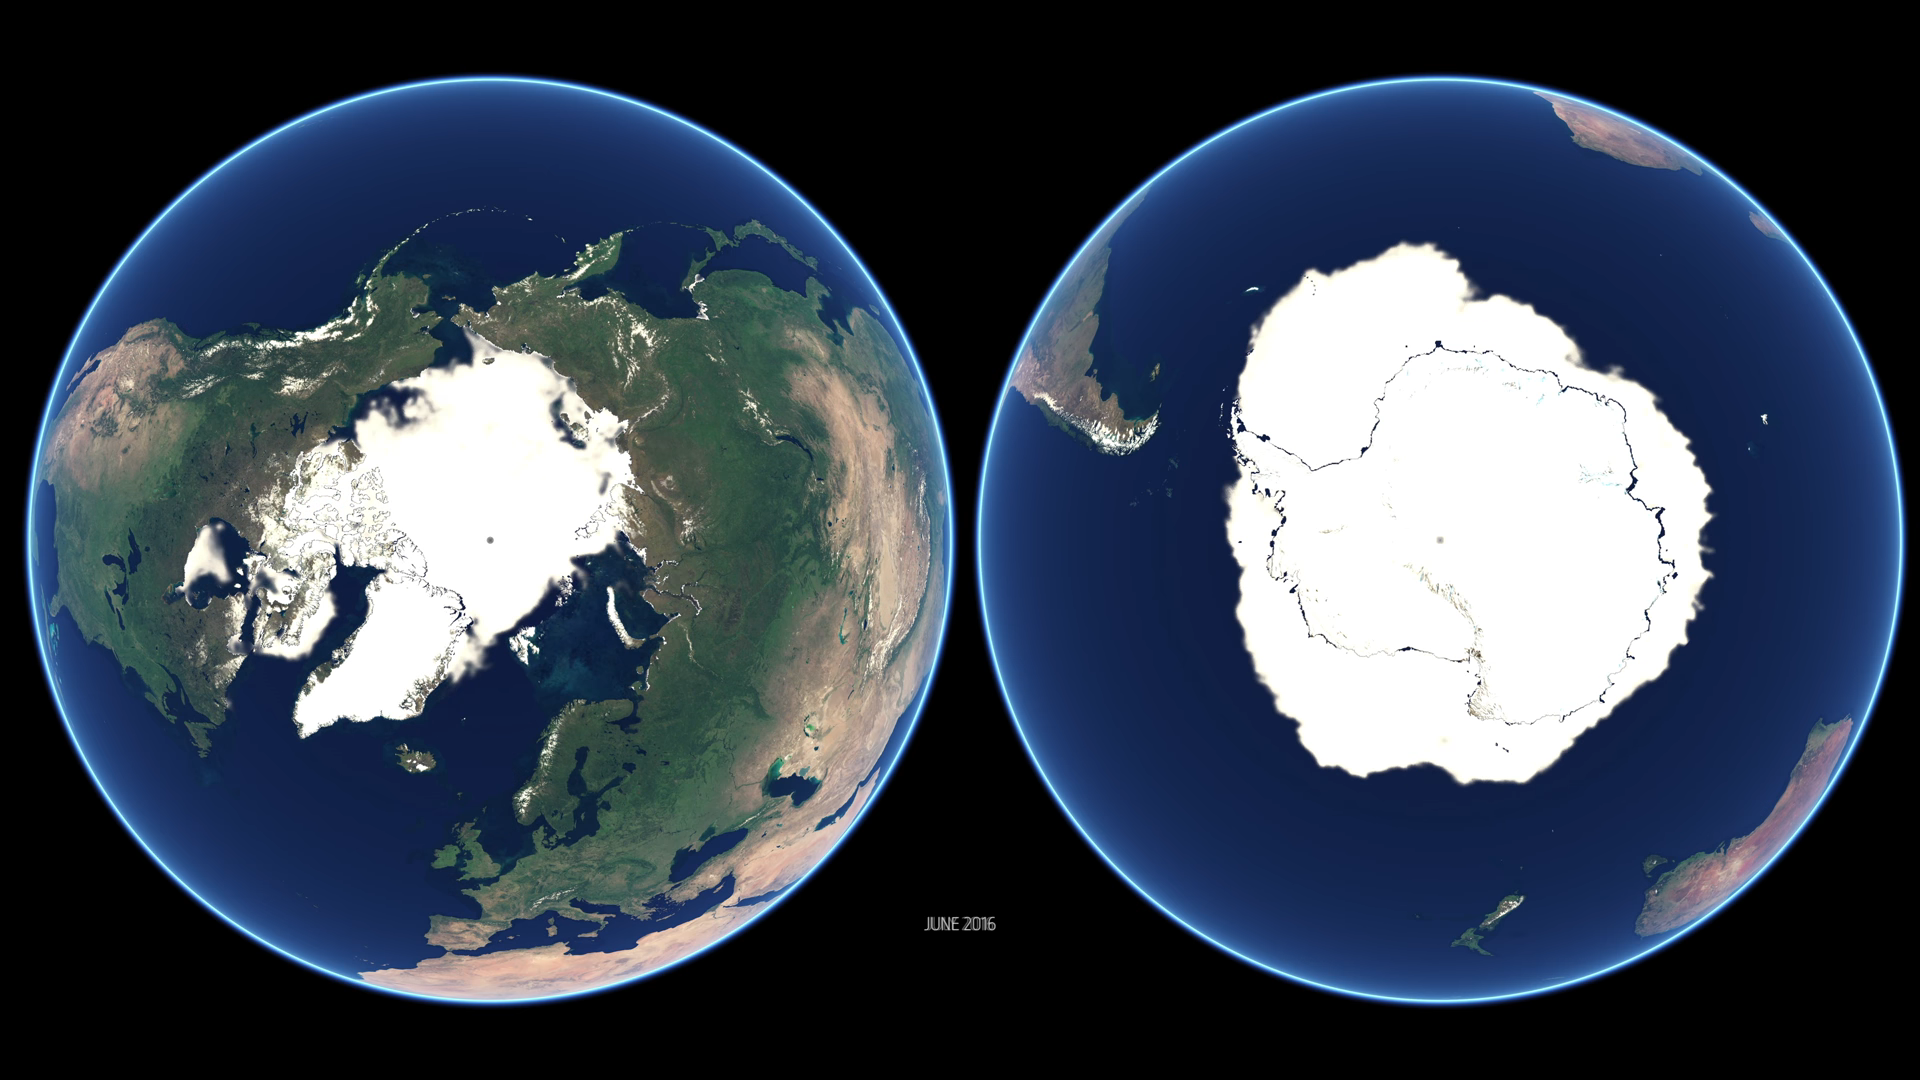
A year of polar ice - 2016
This visualisation shows the polar ice concentration of the northern and southern hemispheres throughout 2016, as seen by the DMSP and Metop satellites.
©
EUMETSAT
Source Link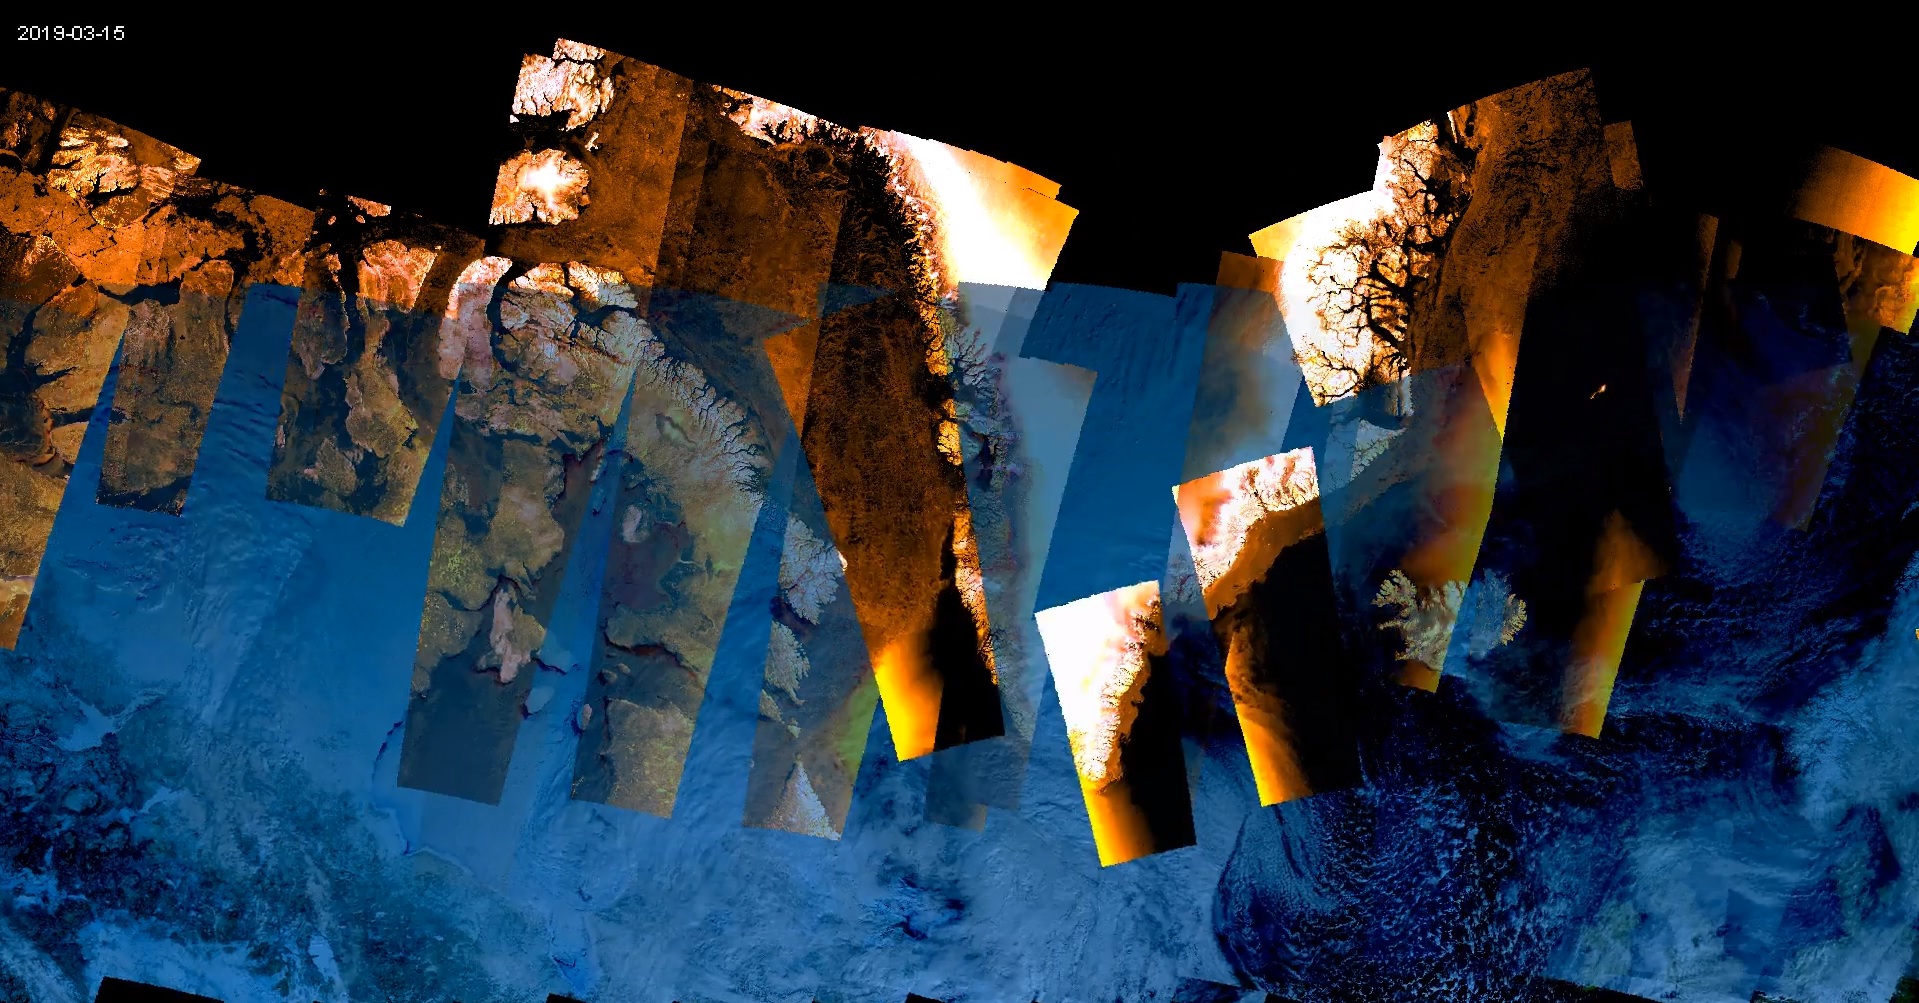
Sentinel-1 and 3 arctic coverage
This animation is of satellite data of the Arctic taken over 9 days in March 2019. The blue areas are optical imagery acquired by Sentinel-3, and the orange is an extra wide swath acquired by sentinel-1
©
DLR/Copernicus data
Source Link

Sign up to our newsletter to get updates from Imperative MOOCs
Thank you! Your submission has been received!
Oops! Something went wrong while submitting the form.