
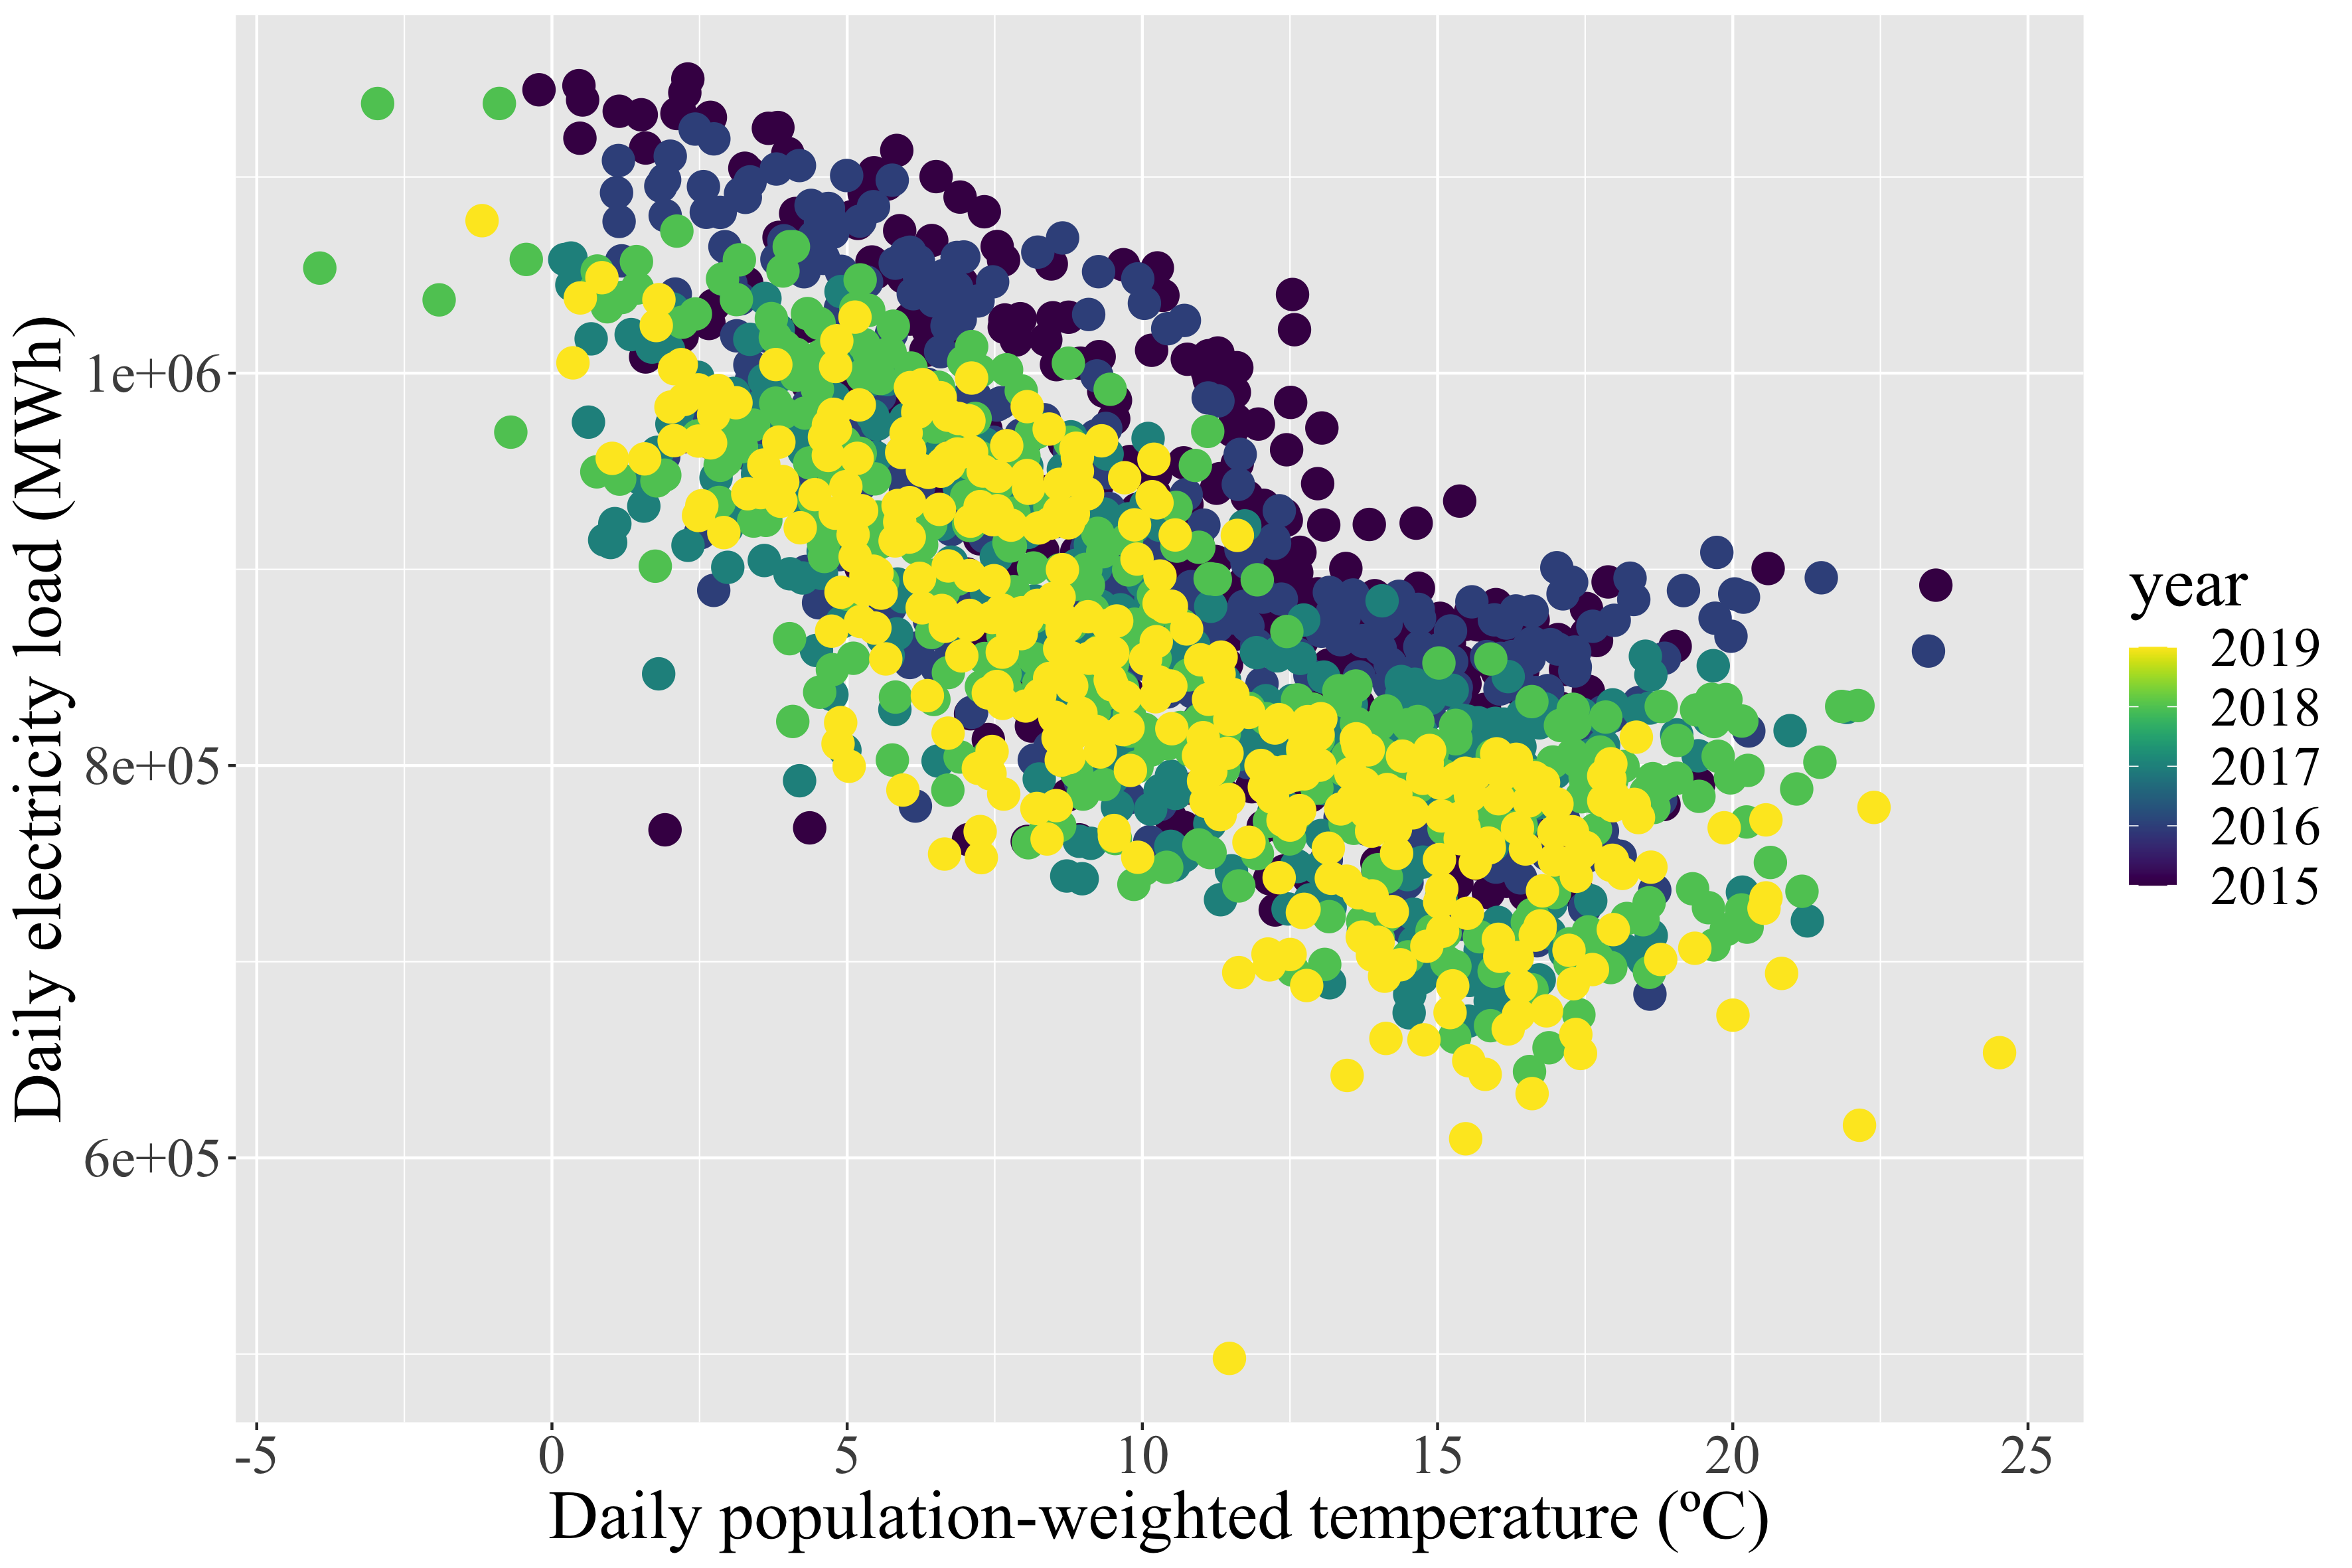
Electricity load to population weighted temperature 2015-2019 (UK)
This graph shows daily population-weighted temperature in the UK from 2015 - 2019 compared to daily electricity load
Marc Guevara
Image sourceBack to topic

Sign up to our newsletter to get updates from Imperative MOOCs
Thank you! Your submission has been received!
Oops! Something went wrong while submitting the form.