
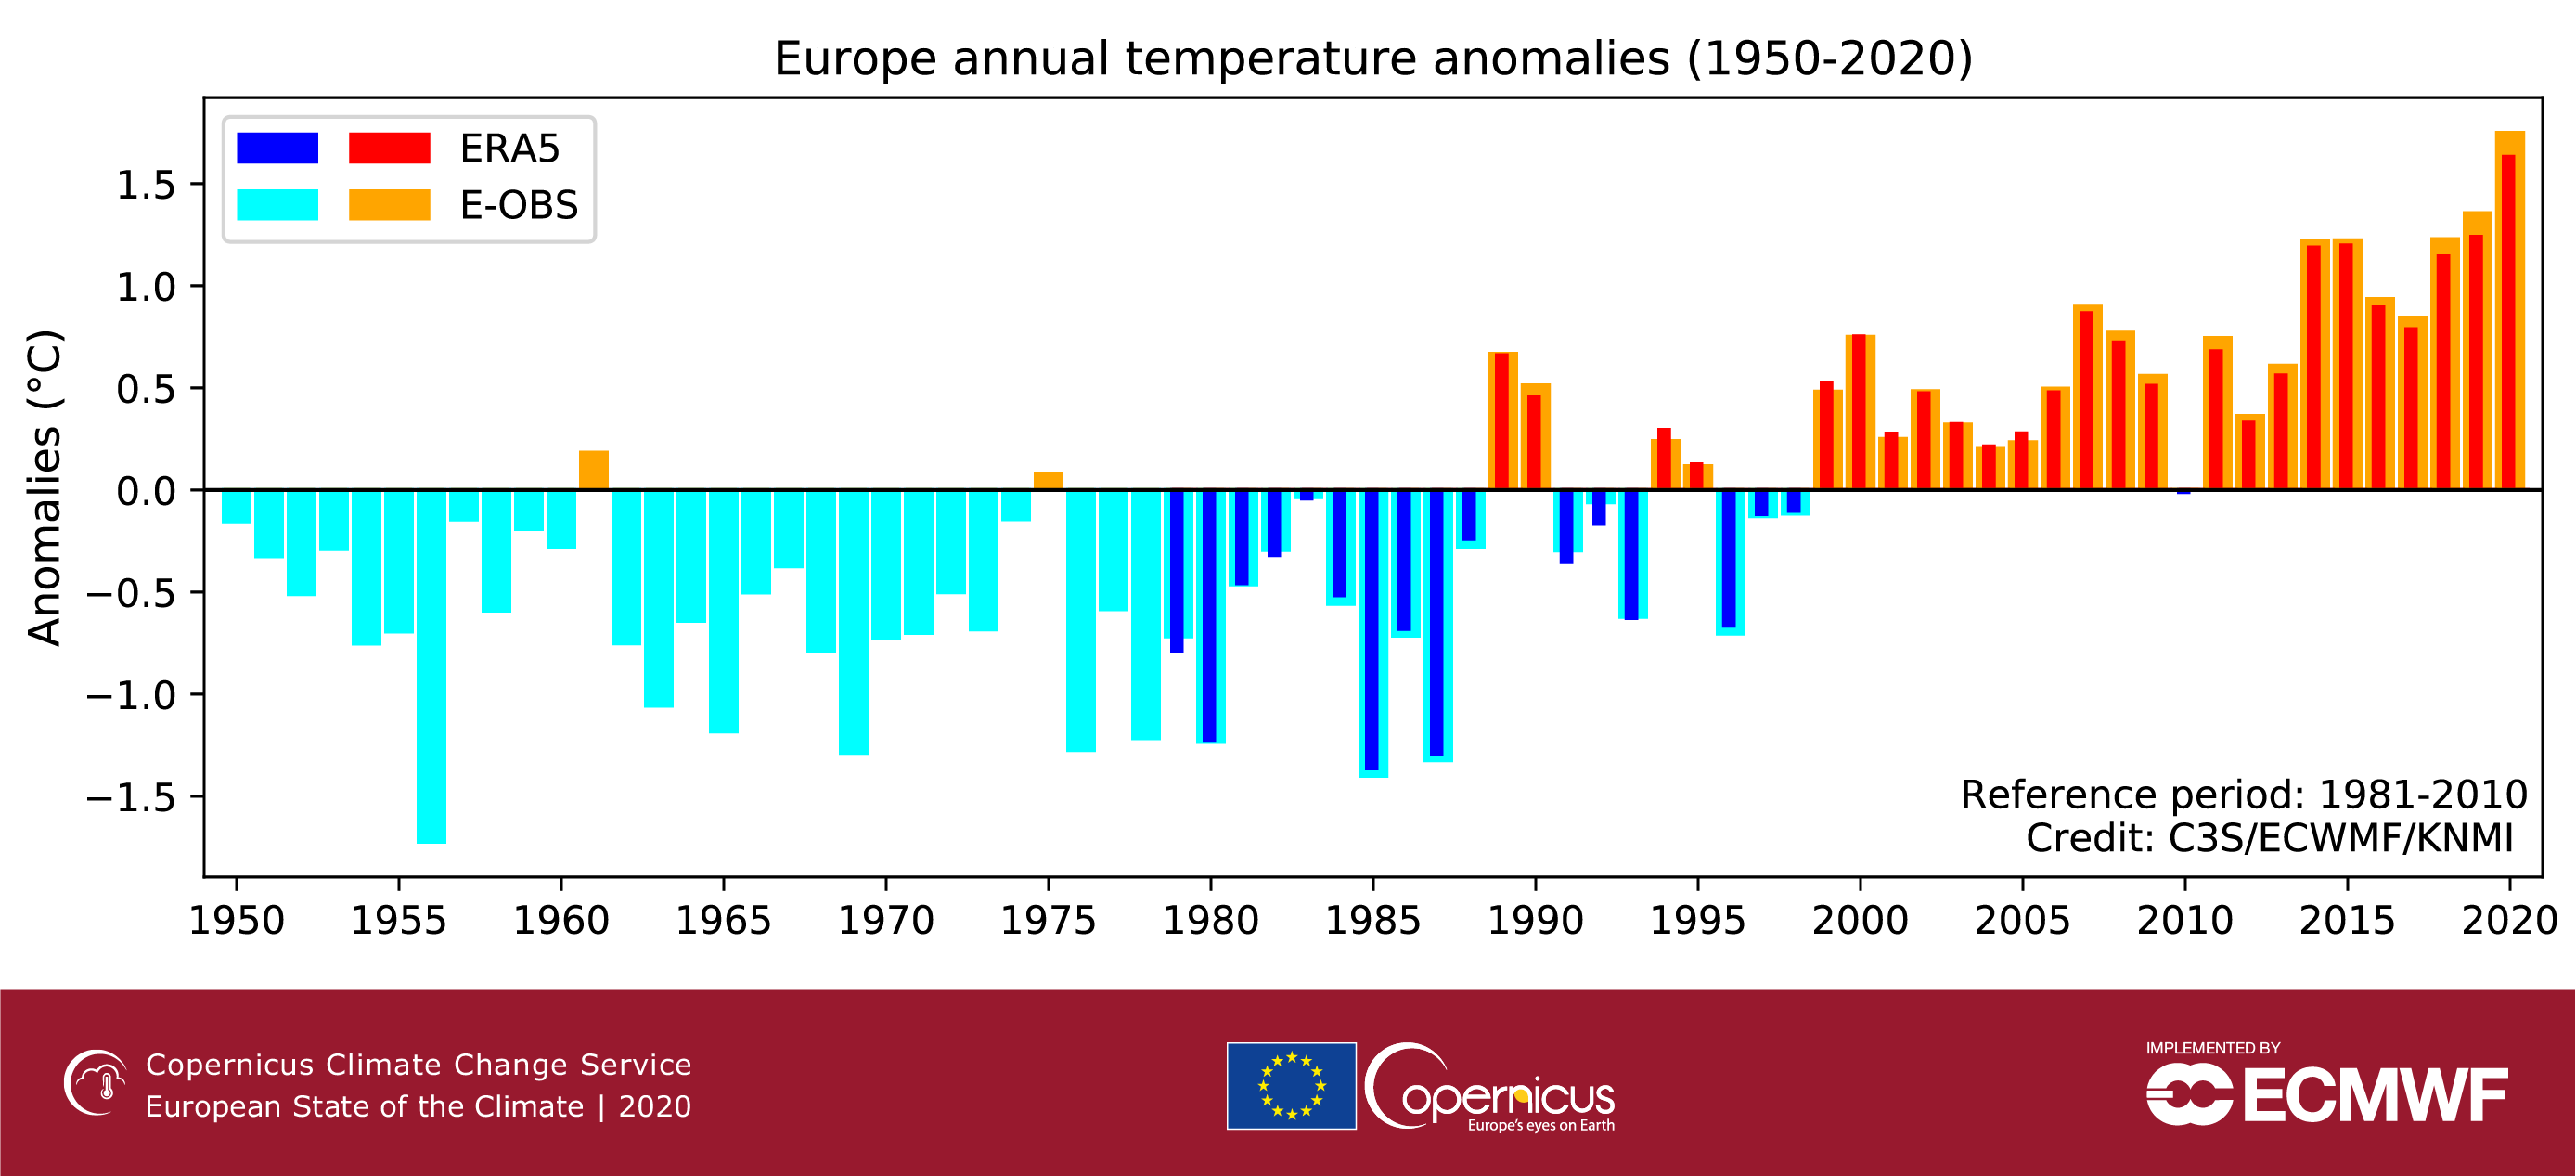
European Annual Temperature Anomalies
This graph shows European average temperature anomalies from 1950-2020 from ERA5 and E-OBS reanalysis data
Copernicus Climate Change Service
Image sourceBack to topic

Sign up to our newsletter to get updates from Imperative MOOCs
Thank you! Your submission has been received!
Oops! Something went wrong while submitting the form.