
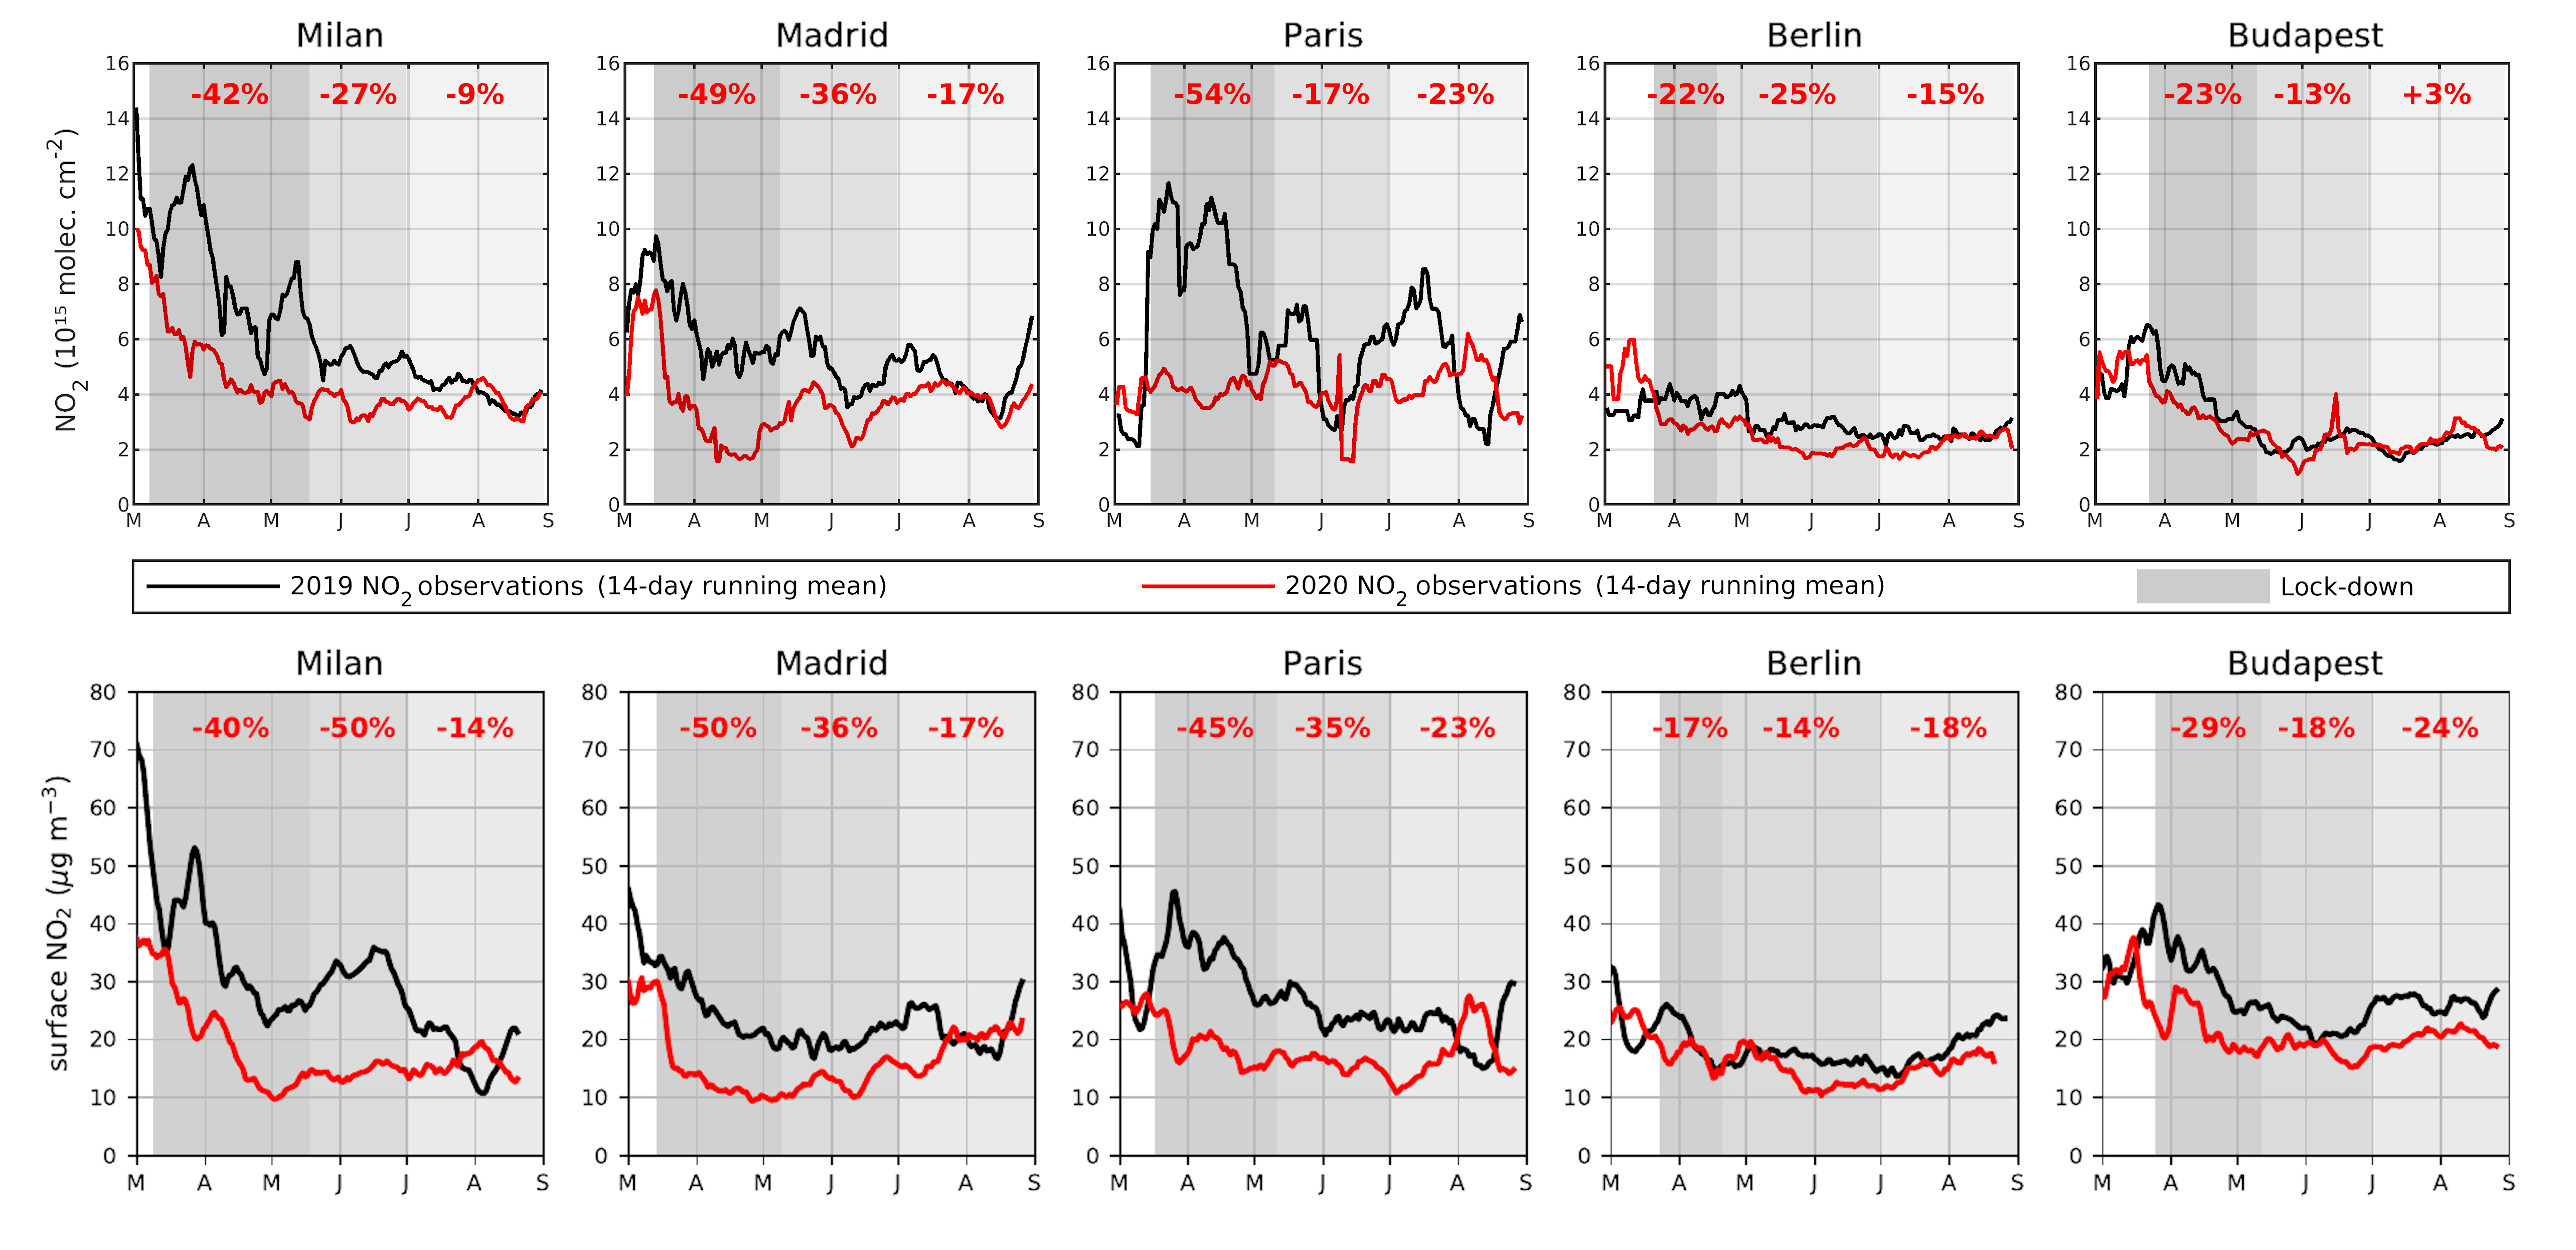
Nitrogen dioxide concentrations observed over major European cities
This graph shows the averaged nitrogen dioxide concentrations over five major European cities. The upper panel shows concentrations (using a 14-day moving average) in 2019 compared to 2020 using data from the Copernicus Sentinel-5P satellite, while the lower panel shows in situ observations.
contains modified Copernicus Sentinel data (2019-20), processed by KNMI/BIRA-IASB
Image sourceBack to topic

Sign up to our newsletter to get updates from Imperative MOOCs
Thank you! Your submission has been received!
Oops! Something went wrong while submitting the form.