
Nitrogen dioxide concentrations over densely populated and industrialised areas of Europe
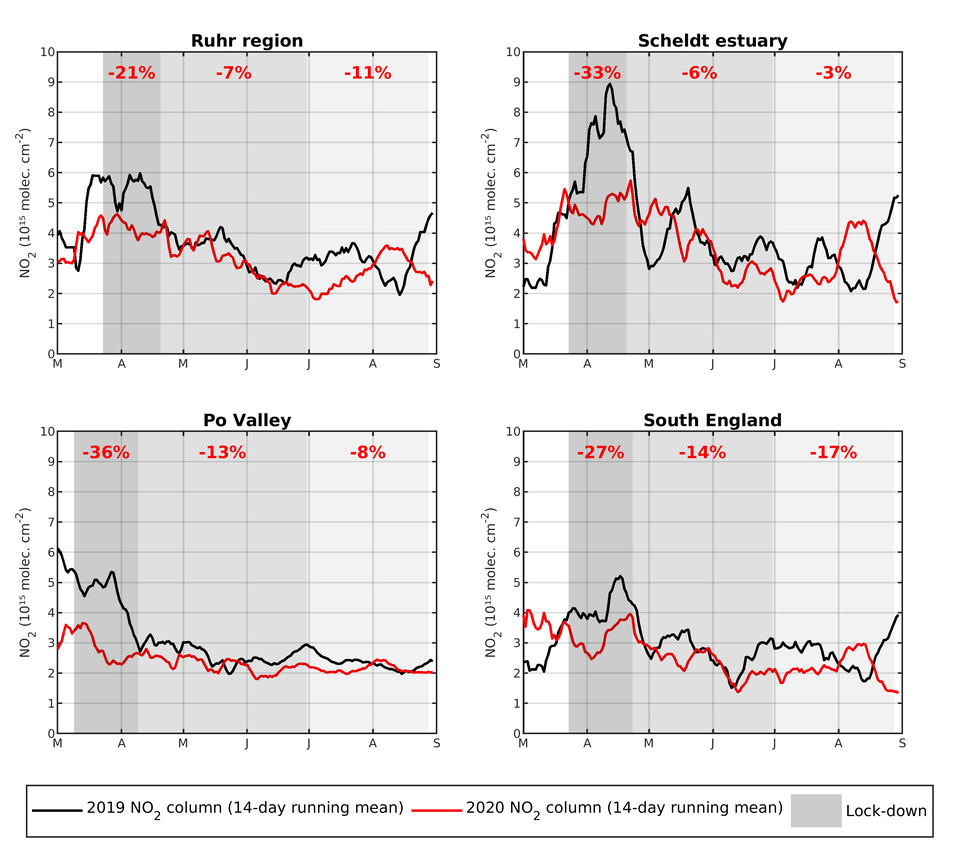
This graph shows the averaged nitrogen dioxide concentrations over the Ruhr region, Scheldt estuary, Po Valley and South England. The graphs shows concentrations (using a 14-day moving average) in 2019 compared to 2020 using data from the Copernicus Sentinel-5P satellite.
contains modified Copernicus Sentinel data (2019-20), processed by KNMI/BIRA-IASB
Image sourceBack to topic

Sign up to our newsletter to get updates from Imperative MOOCs
Thank you! Your submission has been received!
Oops! Something went wrong while submitting the form.