
Reductions in NO₂ along highways in China
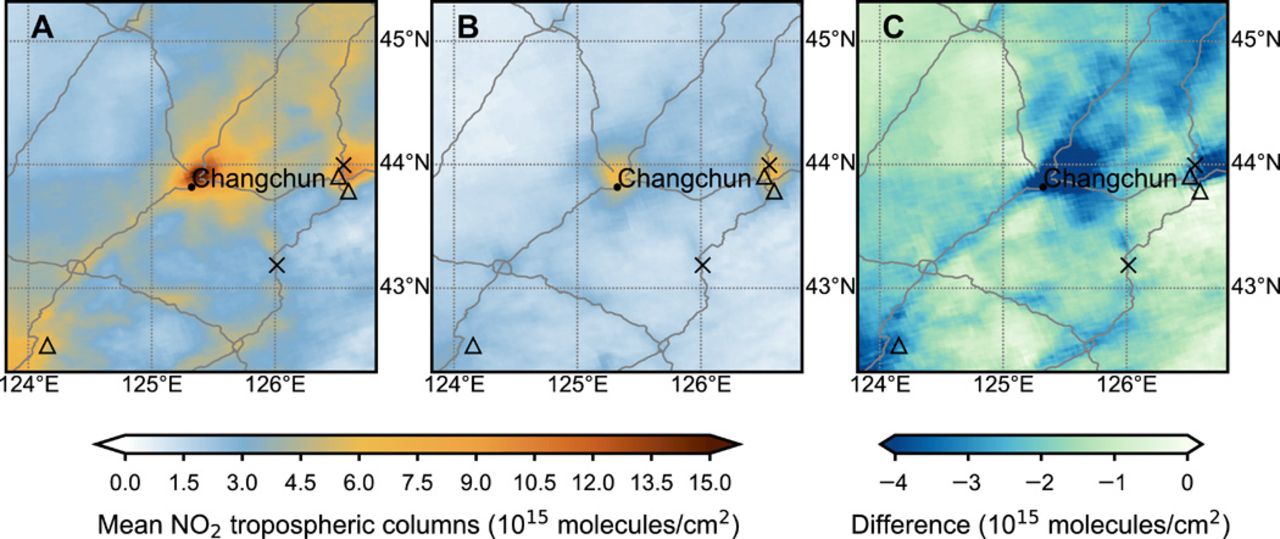
Average TROPOMI NO₂ TVCD over Changchun, China (black dots) for 20 days (A) before and (B) after the 2020 LNY and (C) their difference. The locations of large power plants and other industrial plants are indicated by triangles and crosses, respectively. The lines show China National Highways.
Liu F, et al., 2020
Image sourceBack to topic

Sign up to our newsletter to get updates from Imperative MOOCs
Thank you! Your submission has been received!
Oops! Something went wrong while submitting the form.