
Topic 3B - Land Cover Classification
Most metropolitan areas face increasing problems connected to irregular urban expansion, loss of natural vegetation, decreasing of open space and general reduction of spatial extension. Towns have turned from small, isolated centres to big settlements. “Soil Sealing” is a phenomenon that is now recognized by the EEA as one of the eight main threats to the environment.
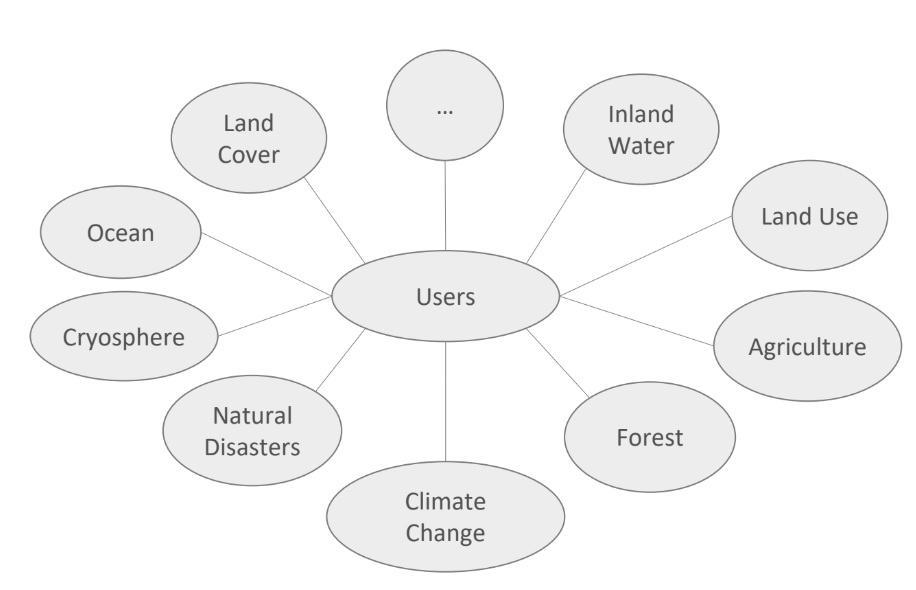
The importance of AI in monitoring land cover changes by means of EO data at various scales – continental, national and local – is crucial from at least two points of view because it reduced the photointerpretation loads and assures the objectivity of results.
No items found.
Optional Further Reading
Featured Images and Example Data
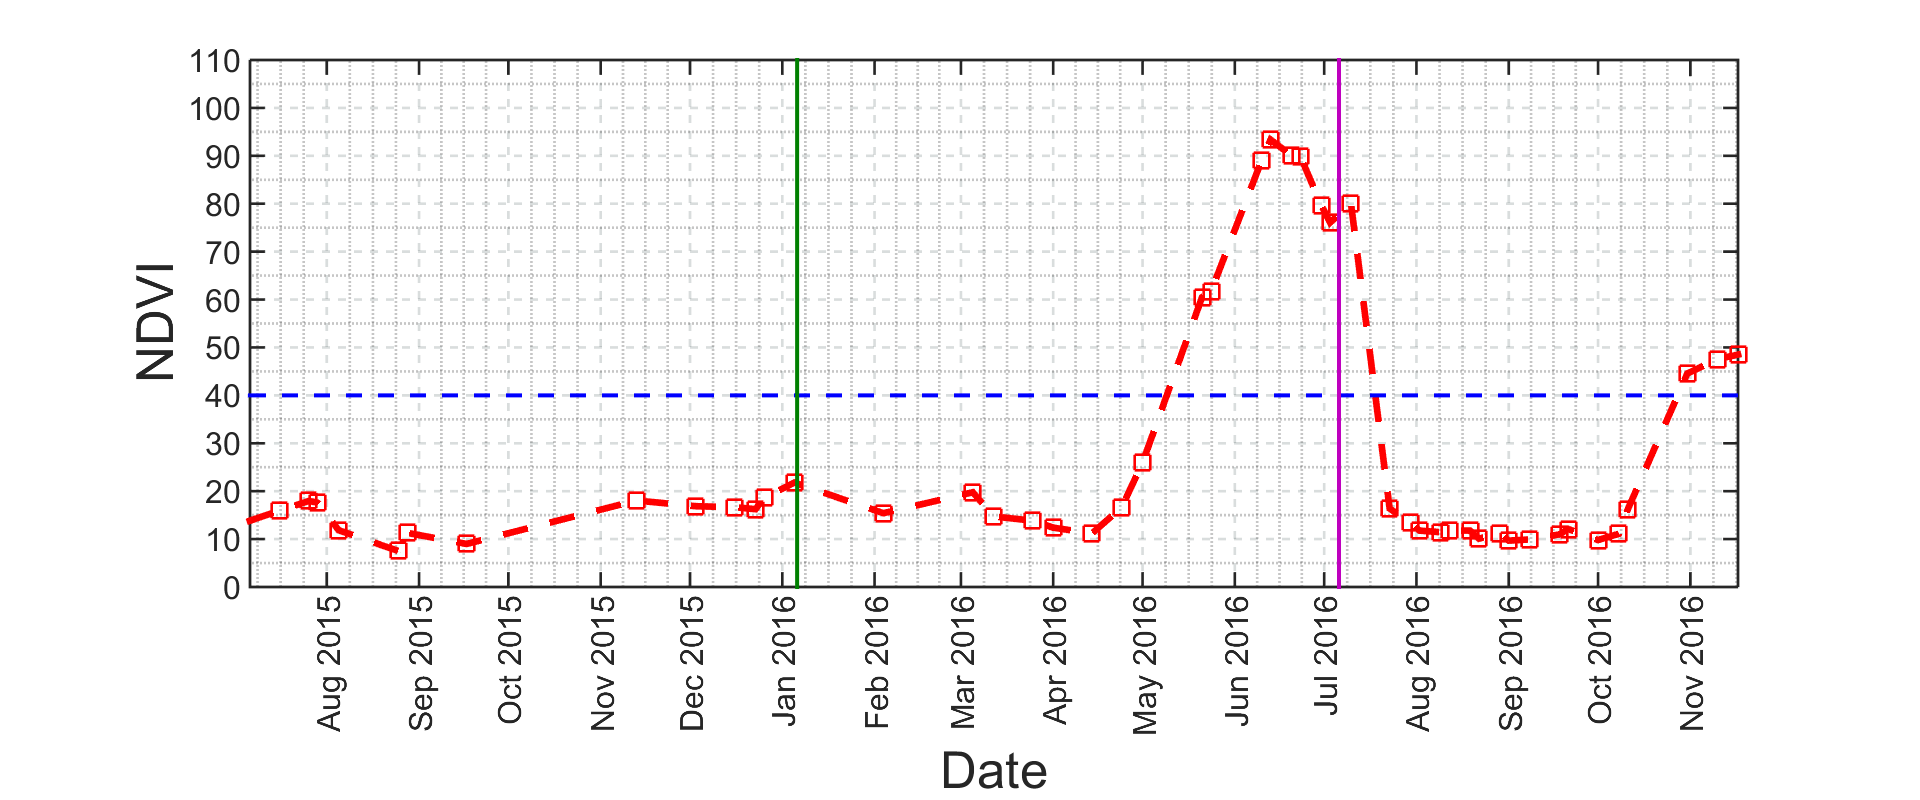
Natural long term changes crop field phenological cycles
This graph shows the natural changes in the phenology cycle over Barrax, Spain, measured by the Sentinel-2 normalized difference vegetation index (NDVI), from August 2015 to November 2016
©
Francesca Bovolo, et al., 2018
Source Link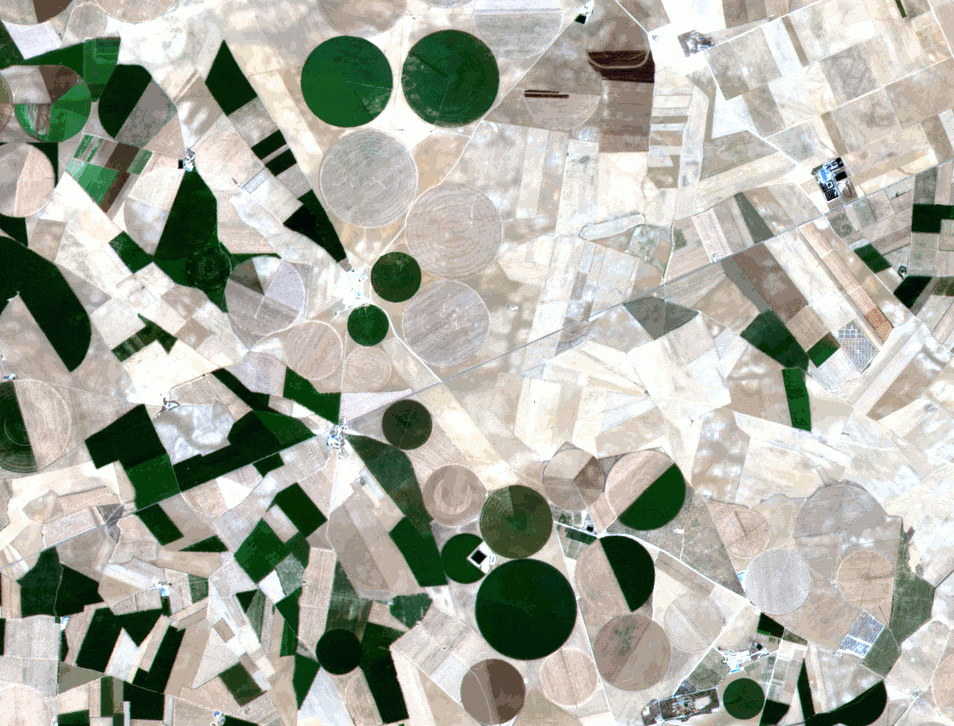
Time series of Sentinel-2 images, Barrax Spain
This is a time series of crop fields in Barrax Spain taken by Sentinel-2 showing the natural phenological cycles
©
Francesca Bovolo, et al., 2018
Source Link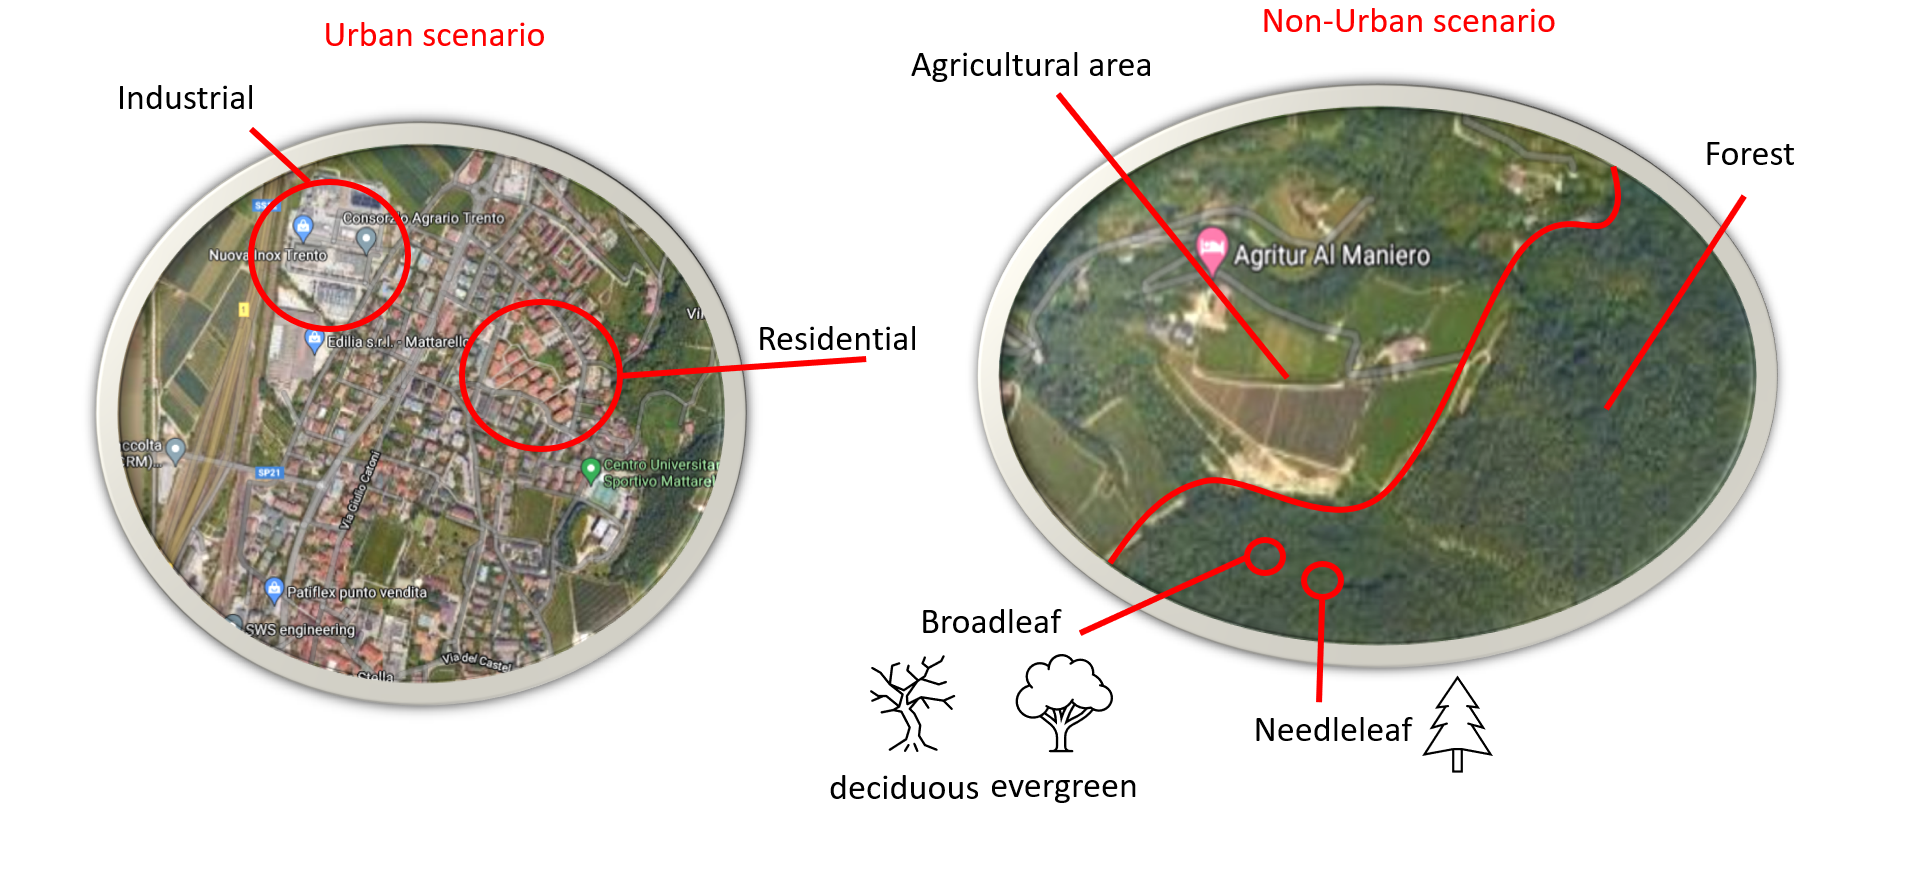
Urban Vs Non-Urban
This image shows example satellite features for an urban land area (left) and non-urban area (right)
©
Francesca Bovolo/Google Maps
Source LinkFeatured Video and Animations
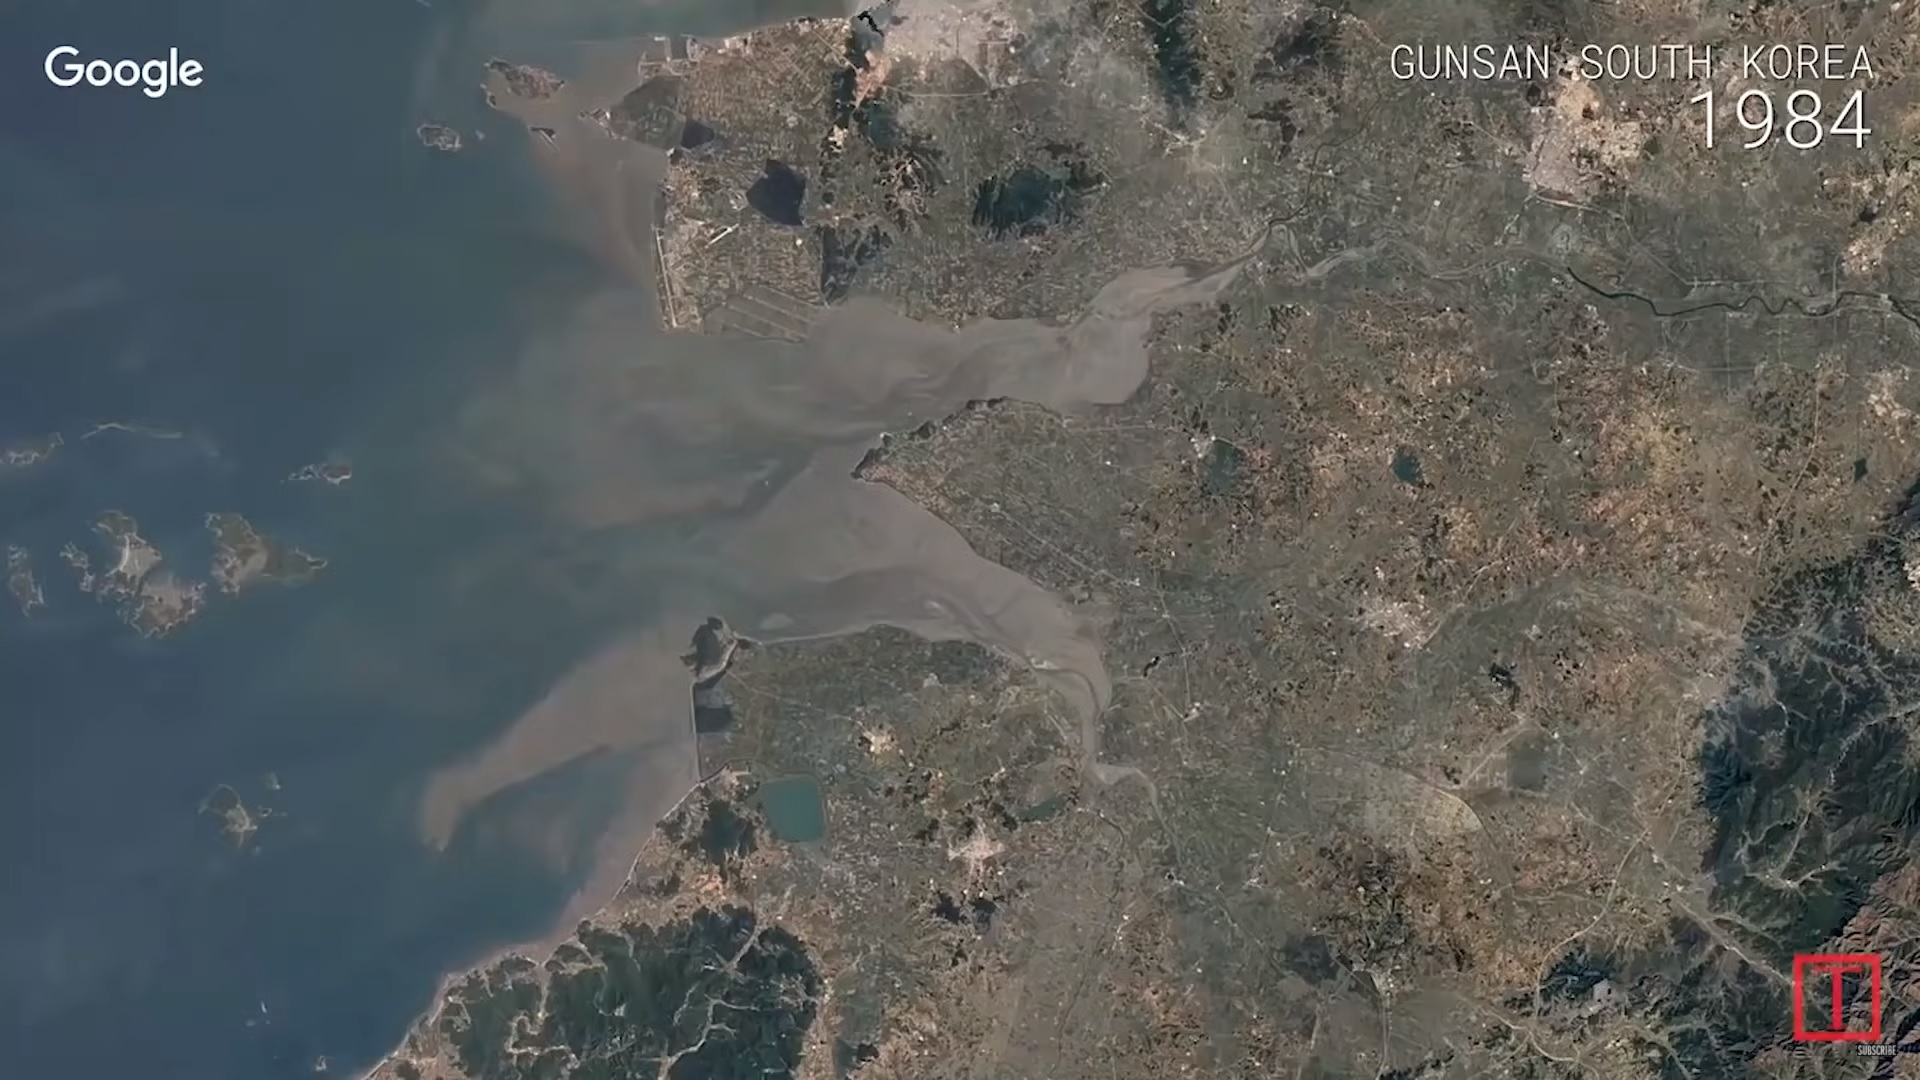
Three Decades of Earth Seen From Space
This video from Time shows 3 decades of Earth taken via satellite from 1984 to 2016
©
TIME
Source LinkDownload Resources
No items found.
Discussion
Sign up to our newsletter to get updates from Imperative MOOCs
Thank you! Your submission has been received!
Oops! Something went wrong while submitting the form.
No items found.